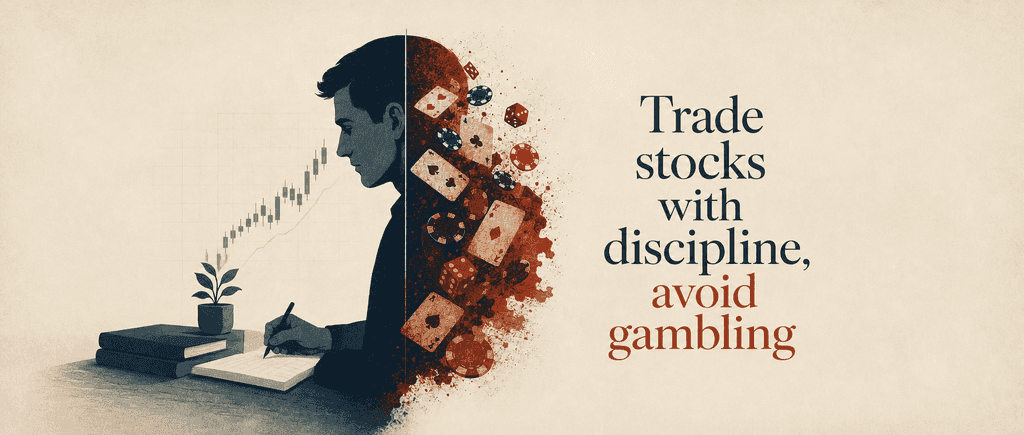
Master trader Robert Carver's "Systematic Trading" revolutionizes investing with emotion-free frameworks endorsed by industry titans Perry Kaufman and Andreas Clenow. Ever wonder why professional traders rarely panic? This blueprint for disciplined, diversified strategies might be finance's most valuable defense against your own psychology.
Robert Carver, author of Systematic Trading, is a seasoned systematic futures trader and bestselling authority on quantitative finance. A former portfolio manager at AHL (a $25 billion Man Group hedge fund), he managed multi-billion-dollar fixed income portfolios and pioneered the firm’s global macro strategy. His expertise spans derivatives trading at Barclays Investment Bank, academic research, and designing automated trading systems, which he now applies to his personal portfolio.
Carver’s work, including Smart Portfolios and Leveraged Trading, bridges institutional strategies with practical insights for retail traders. He shares advanced techniques through his blog, Systematic Money.
He also lectures at Queen Mary University of London, where his course on systematic trading shapes future finance professionals. Featured on platforms like The Alpha Mind Podcast, Carver distills complex market mechanics into actionable frameworks. His books are widely cited in academic programs and professional trading circles, cementing his reputation as a foundational voice in modern systematic investment strategies.
Systematic Trading outlines a structured framework for designing and implementing rule-based trading systems that minimize emotional decision-making. Robert Carver emphasizes robust risk management, diversified portfolio construction, and rigorous backtesting to avoid common pitfalls like overfitting. The book provides practical tools for volatility targeting, position sizing, and adapting strategies to shifting market conditions.
This book suits traders and investors seeking a disciplined, data-driven approach to markets. It’s particularly valuable for those managing multi-asset portfolios, part-time traders aiming for consistency, and professionals looking to reduce discretionary biases. Beginners may find the mathematical rigor challenging but will gain foundational insights into systematic methodologies.
Yes—Carver combines academic rigor with real-world experience, offering actionable strategies for risk-adjusted returns. The book stands out for its emphasis on simplicity (e.g., favoring equal-weighted portfolios over complex optimizations) and warnings against overconfidence. Traders praise its clear examples on backtesting and volatility scaling.
Carver advocates manually constructing portfolios using equal weights and diversification principles rather than relying on opaque algorithmic optimizations. This approach reduces overfitting risks while maintaining transparency. For example, he suggests grouping assets by volatility and correlation before assigning equal risk allocations.
The book prioritizes volatility targeting—adjusting position sizes based on asset volatility to maintain consistent risk exposure. Carver also emphasizes capping maximum losses per trade and diversifying across uncorrelated strategies. He warns against overleveraging low-volatility instruments, which can lead to outsized losses during market shifts.
Carver insists backtests must account for transaction costs, liquidity constraints, and survivorship bias. He discourages curve-fitting by testing strategies on out-of-sample data and multiple market regimes. The book provides frameworks to distinguish genuine edge from statistical flukes.
“Success in systematic trading is mostly down to avoiding common mistakes like overcomplicating your system, being too optimistic about returns, and trading too often.” This underscores Carver’s focus on robustness over complexity, advocating simple rules that withstand diverse conditions.
Carver argues systematic methods outperform discretionary trading for most investors by eliminating emotional biases. While acknowledging exceptional discretionary traders exist, he notes structured systems reduce variance in outcomes and improve scalability across assets.
The book suggests focusing liquid futures and forex markets with moderate volatility, avoiding illiquid or extremely stable instruments. Carver’s framework targets assets like equity indices, government bonds, and major commodities, emphasizing diversification across 20-40 markets.
Some traders argue Carver’s equal-weight portfolio approach lacks sophistication versus machine learning methods. Others note his volatility-targeting framework struggles during sudden market regime changes. However, most praise the book’s practicality for retail and semi-professional traders.
Carver provides a template for daily-traded futures strategies requiring 1-2 hours of monitoring. Key steps include automating trade execution, focusing on longer timeframes (weeks to months), and using free market data sources. He cautions against high-frequency strategies for time-constrained traders.
In the epilogue, Carver highlights humility, skepticism, thriftiness, and diligence. Successful traders rigorously stress-test assumptions, maintain conservative risk parameters, and avoid chasing “black box” solutions. He also humorously notes the value of luck in surviving rare tail events.
Почувствуйте книгу через голос автора
Захватите ключевые идеи мгновенно для быстрого обучения
what you need is the temperament to control the urges that get other people into trouble.
Day trading triggers the same neurological pathways as gambling addiction.
Most profits come from compensation for taking specific types of risk.
Understanding your strategy's skew is crucial for proper risk management.
The greatest danger in systematic trading is over-fitting.
Задавайте любые вопросы, выбирайте свой стиль обучения и создавайте идеи, которые действительно вам подходят.

Создано выпускниками Колумбийского университета в Сан-Франциско
"Instead of endless scrolling, I just hit play on BeFreed. It saves me so much time."
"I never knew where to start with nonfiction—BeFreed’s book lists turned into podcasts gave me a clear path."
"Perfect balance between learning and entertainment. Finished ‘Thinking, Fast and Slow’ on my commute this week."
"Crazy how much I learned while walking the dog. BeFreed = small habits → big gains."
"Reading used to feel like a chore. Now it’s just part of my lifestyle."
"Feels effortless compared to reading. I’ve finished 6 books this month already."
"BeFreed turned my guilty doomscrolling into something that feels productive and inspiring."
"BeFreed turned my commute into learning time. 20-min podcasts are perfect for finishing books I never had time for."
"BeFreed replaced my podcast queue. Imagine Spotify for books — that’s it. 🙌"
"It is great for me to learn something from the book without reading it."
"The themed book list podcasts help me connect ideas across authors—like a guided audio journey."
"Makes me feel smarter every time before going to work"
Создано выпускниками Колумбийского университета в Сан-Франциско

Получите резюме книги «Systematic Trading» в формате PDF или EPUB бесплатно. Распечатайте или читайте офлайн в любое время.
Warren Buffett once remarked that "success in investing doesn't correlate with IQ... what you need is the temperament to control the urges that get other people into trouble." Few books embody this principle more thoroughly than Robert Carver's "Systematic Trading." As a former portfolio manager at AHL, one of the world's largest systematic hedge funds where he managed multi-billion dollar portfolios through the 2008 financial crisis, Carver offers rare insider knowledge on how to remove emotion from financial decisions. The book has developed a cult following among professional traders and institutional investors, with legendary quantitative trader Nassim Taleb praising its approach to risk management. Perhaps most compelling is how Carver himself was forced to develop these systems after recognizing his own psychological weaknesses-despite his extensive financial expertise, he found himself making poor emotional decisions with his personal investments, just like the average investor.
Our human minds, despite their remarkable capabilities, are fundamentally flawed when making financial decisions. The evidence is overwhelming: studies consistently show that most active investors underperform simple index funds, with even professional fund managers failing to beat their benchmarks after fees. This isn't because we lack intelligence-it's because our brains evolved for survival in prehistoric environments, not for modern financial markets. Consider what happens when we invest. We run losses, hoping they'll recover ("get-evenitis"), while taking small profits too quickly to confirm our decisions were correct. This behavior, explained by prospect theory in behavioral economics, consistently underperforms in real markets. In one striking study, an "early loss taker" rule beat the natural "early profit taker" approach in 27 of 31 futures contracts tested. Our brains also create addictive relationships with trading. The most addictive activities feature an illusion of control, frequent near-misses, and rapid continuous play-all present in active investing. Day trading, with its constant action and feedback, triggers the same neurological pathways as gambling addiction. Even sophisticated investors aren't immune; they're just better at rationalizing their behavior. This is where systematic trading offers salvation. By creating objective rules that exploit both our own weaknesses and those of other traders, we can overcome our psychological biases. Finding explanations for rule profitability based on cognitive biases gives confidence that these aren't just statistical anomalies but should continue working unless human behavior fundamentally changes. The greatest challenge, however, is avoiding "meddling"-the overconfident interference with our own systems. We rationalize breaking rules "just this once" because we believe our intelligence will produce better decisions than our pre-set systems. To prevent this, we need commitment mechanisms-like Odysseus being tied to the mast to resist the Sirens, or as one trader put it: "the ideal setup is a computer, a man, and a dog-the computer runs the strategy, the man feeds the dog, and the dog bites the man if he touches the computer."
A trading rule is simply a systematic way of predicting price movements. Good rules assume the future will resemble the past and can be developed through either "data first" (mining data for patterns) or "ideas first" (testing hypotheses against data). The ideas-first approach typically produces simpler, more intuitive rules with less risk of over-fitting, while data-first methods can uncover novel strategies but risk finding patterns that won't persist. Understanding why your trading rules make money is crucial. Most profits come from various risk premia-essentially compensation for taking specific types of risk. For example, negatively skewed assets (like selling insurance) have frequent small gains but occasional catastrophic losses, while positively skewed assets (like buying insurance) have more frequent small losses but better downside protection and occasional large gains. Most people strongly dislike negative skew, which explains why they buy home insurance and why relative value strategies must offer premium returns. Conversely, positive skew is attractive, explaining why rational people buy lottery tickets despite their negative expected value. These preferences create profit opportunities for those willing to take the opposite side of these behavioral tendencies. Other sources of trading profits include leverage premia (many investors can't or won't use leverage, creating opportunities for those who can), liquidity premia (less liquid assets typically offer higher returns), forced trading (when others must trade for non-profit reasons like central bank currency interventions), and barriers to entry (strategies requiring significant investment in technology or expertise). When selecting trading styles, consider whether you prefer static approaches (minimal intervention after initial investment) or dynamic ones (active trading based on signals). Also important is your strategy's expected skew-positive skew strategies have frequent small losses and infrequent large gains, while negative skew produces frequent small gains but rare catastrophic losses. Understanding your strategy's skew is crucial for proper risk management. Trading speed also matters tremendously. Very slow systems (holding for months to years) resemble static portfolios with gradual position changes. Medium-speed strategies (hours to months) offer statistically significant profits that can be properly back-tested and are accessible to part-time traders. Fast strategies (microseconds to one day) can achieve high theoretical Sharpe ratios but require sophisticated execution algorithms and automation.
The greatest danger in systematic trading is over-fitting-creating systems that work perfectly on historical data but fail miserably in live trading. This happens because humans are pattern-recognition machines; we see meaningful relationships even in random data. When we test too many trading rules or variations against limited historical data, some will appear profitable purely by chance. Consider this sobering reality: determining whether a trading rule with a Sharpe ratio of 0.5 (quite good for a single instrument) is genuinely profitable requires over ten years of data for statistical confidence. Rules with a more typical Sharpe ratio of 0.3 need nearly 40 years! Only extremely profitable rules with Sharpe ratios above 1.0 can be validated in just a few years. Comparing two trading rules requires even more data. For two uncorrelated rules with Sharpe ratios of 0.3 and 0.8, it takes about 30 years to be statistically confident that one outperforms the other. This explains why rule selection based on short-term performance is usually futile and why so many back-tested systems disappoint in live trading. The multiple testing problem further complicates matters. When testing 100 random rules with zero expected returns against a minimum Sharpe ratio threshold of 2.0, about 2.3 will appear profitable purely by chance. The larger the pool of tested rules, the more false positives emerge. To avoid these pitfalls, follow these guidelines: keep fitting methods simple, consider fewer rule alternatives, ban "time machines" by using proper out-of-sample testing, and don't casually discard rules based on limited performance data. Most importantly, pool data across multiple instruments rather than fitting each instrument separately, as this provides more statistical power. My own approach avoids fitting almost completely by selecting trading rules and variations without examining actual performance data. I develop a small number of trading rules for each market behavior concept, select a few variations based on behavior rather than performance, and allocate forecast weights that account for uncertainty about Sharpe ratios. This approach reserves performance data solely for determining forecast weights, reducing the risk of over-fitting.
Portfolio allocation-deciding how to distribute capital across different assets or trading rules-presents another challenge where naive approaches often fail. Classic portfolio optimization, while mathematically elegant, frequently produces unstable, extreme allocations that change dramatically over time and perform poorly in real trading despite looking excellent in backtests. Using a simple three-asset example (NASDAQ, S&P 500, and 20-year US bonds), classic Markowitz optimization initially allocates everything to NASDAQ during the tech boom, then completely abandons it after the crash, and heavily favors bonds for most of the period. Such extreme swings aren't practical for real-world investing. The problem stems from treating statistical estimates as certain when they're actually highly uncertain. Equal weighting often outperforms optimization in practice, especially when assets have similar volatility, Sharpe ratios, and correlations. However, with significantly different Sharpe ratios or correlations, equal weighting becomes suboptimal. Bootstrapping offers one solution by averaging the results of many optimizations performed on different data subsets. This approach acknowledges uncertainty about which past periods will repeat, producing more stable weights that naturally reflect the data's uncertainty. While individual optimizations may still produce extreme weights, their average is unlikely to be extreme. An even simpler approach is "handcrafting"-a bottom-up method that groups similar assets together and assigns weights based on correlation patterns. This process becomes modular for larger portfolios: first forming groups of similar assets, calculating weights within each group, then determining weights between groups. This practical approach provides consistent, sensible allocations without requiring sophisticated software. When you have valid information about relative asset Sharpes-such as known cost differences or back-tested trading rule performance-you can adjust handcrafted weights accordingly. Through experiments with random data, I've determined appropriate adjustment factors based on how certain you are about Sharpe ratio differences. For precisely known differences (like trading costs), the adjustments are substantial, while for historically estimated Sharpes with less than ten years of data, no adjustment is recommended since estimates aren't statistically significant in short periods.
Rather than offering pre-packaged strategies like fast food, a proper systematic approach provides a framework for creating your own trading system-it's a guide to writing recipes from scratch. This modular framework separates trading rules (the engine) from the position risk management framework (the chassis and drivetrain), offering flexibility to adapt components for different trading styles. Like building a car, each component can be optimized independently while working harmoniously within the larger system. The framework consists of several interconnected elements that work together like a well-oiled machine: 1. **Instruments**: What you trade and hold positions in-financial assets including directly held instruments like equities and bonds, derivatives like options and futures, or collective funds such as ETFs. The selection should consider liquidity, trading costs, correlation benefits, and market accessibility. For example, a global macro trader might use currency futures, bond futures, and equity index futures across major markets, while a stock trader might focus on large-cap equities and sector ETFs. 2. **Forecasts**: Estimates of how much a particular instrument's price will change using a specific trading rule variation. These can range from complex systematic rules to simple constant values or discretionary predictions. Examples include momentum indicators, mean reversion signals, fundamental factors, or sentiment measures. A momentum strategy might use 12-month price returns, while a value strategy could employ price-to-book ratios. 3. **Combined Forecasts**: When you have multiple forecasts for an instrument, you combine them into a single prediction using weighted averages. This allows for sophisticated signal blending, such as combining short-term mean reversion with longer-term trend following, or technical signals with fundamental factors. Weights can be static or dynamically adjusted based on recent performance. 4. **Volatility Targeting**: Defines how much overall risk you want in your trading system, measured as the typical average daily loss you're willing to accept. This could be set at different levels - conservative investors might target 5% annualized volatility, while more aggressive traders might aim for 15-20%. The system automatically adjusts position sizes as market volatility changes. 5. **Scaled Positions**: Position sizing that depends on instrument risk, forecast confidence, and your volatility target. This ensures that higher conviction trades get larger allocations while maintaining consistent risk levels. For instance, a strong signal in a low-volatility market might result in a larger position than a weak signal in a highly volatile market. 6. **Portfolios**: How you allocate capital across different trading subsystems using instrument weights. This includes considerations of correlation, diversification, and strategic tilts. A global portfolio might allocate 40% to equities, 40% to bonds, and 20% to commodities, with further subdivision within each asset class. This framework works for various trader types, from pure systematic to discretionary. Asset allocating investors who don't believe markets can be predicted can use a constant forecast of +10 for all instruments, creating an effective risk parity strategy. Semi-automatic traders who make discretionary forecasts can use the framework to manage position sizing and risk. Staunch systems traders can implement multiple systematic rules within the framework, combining their signals optimally. The beauty of this approach is that it handles the "boring but vital" parts of system design consistently, allowing you to focus on the aspects where you believe you have an edge. It provides a robust infrastructure for risk management while maintaining flexibility in how you generate trading signals. This separation of concerns allows for continuous improvement and refinement of individual components without disrupting the overall system.
Position sizing answers a crucial question: "How risky is your trade?" Once you understand an instrument's risk characteristics, you can translate abstract forecasts into actual position sizes-specific quantities of shares, contracts, or other instruments you should buy or sell. The process begins by understanding what constitutes "one unit" of an instrument (the "instrument block") and how much exposure that creates (the "block value"). For equities, one share is straightforward, with block value being 1% of share price. Other instruments have less intuitive relationships-a FTSE spread bet at 10/point has a block value of 65 per 1% move at index level 6500. Next, you need to calculate the instrument's price volatility-the expected standard deviation of daily percentage returns. Different instruments have vastly different volatility patterns-equities might move 1% in minutes while bonds might not see such movement for months. For measuring this, you can use an exponentially weighted moving average (EWMA) of daily squared returns with a 36-day look-back for smooth yet responsive measurements. Once you know an instrument's block value and price volatility, you can calculate its instrument currency volatility-the expected standard deviation of daily returns from one instrument block in its native currency. For example, if oil futures have a block value of $750 and price volatility of 1.33%, the instrument currency volatility would be $997.50. Your daily cash volatility target (your annualized volatility target divided by 16) represents the risk you're comfortable with from your trading account. To determine position size, divide this target by the instrument value volatility. For example, an investor with a $1,000,000 annualized volatility target has a daily target of $62,500. If crude oil futures have instrument value volatility of $668.33, they should hold 93.52 contracts to achieve their target risk. This scaling factor between instrument volatility and required portfolio volatility is called the volatility scalar. To adjust for your actual forecast, multiply the volatility scalar by your forecast and divide by 10. With a volatility scalar of 93.52 and a forecast of -6 for crude oil, your position would be -56.11 contracts.
Diversification is often called the only free lunch in investment, yet many traders and amateur investors hold too few assets, typically concentrating in familiar sectors or asset classes. Research shows that allocating across different asset classes - such as equities, bonds, commodities, and currencies - can easily double your expected Sharpe ratio. A well-structured portfolio combines multiple trading subsystems, each handling a single instrument with its own forecast and risk assessment. These subsystems can range from trend-following strategies in commodities to mean reversion in equities or carry trades in currencies. Rather than allocating full capital into each subsystem, you share capital across the portfolio using instrument weights that sum to 100%. Your final position in each instrument is its subsystem position multiplied by its instrument weight, with careful adjustments for portfolio diversification effects. For example, if you have $1 million in capital and a 20% weight in gold futures, your maximum allocation to gold would be $200,000, regardless of other positions. Since all subsystems are volatility standardized with the same expected standard deviation (typically targeting 20% annualized), you can use either handcrafting or bootstrapping methods to determine instrument weights. Handcrafting involves setting weights based on asset class characteristics and market knowledge, while bootstrapping uses historical data to optimize allocations. For weight allocation, you need correlations between subsystem returns, not just instrument returns. For dynamic trading systems like trend-following, subsystem correlations tend to be about 70% of instrument correlations, while static strategies like value investing have correlations closer to the underlying instruments. Diversified portfolios of volatility-standardized trading subsystems typically achieve lower expected standard deviation than individual assets due to imperfect correlations. For instance, a portfolio equally weighted between S&P 500 futures and US Treasury bonds might have half the volatility of either instrument alone. To account for this diversification effect, you need an instrument diversification multiplier (IDM) to ensure your portfolio maintains the right level of expected risk. During the 2008 financial crisis, many seemingly uncorrelated assets became highly correlated, so this multiplier should be limited to an absolute maximum of 2.5 to protect against correlation spikes during market stress periods. The final step is converting these theoretical positions into actual trades while managing transaction costs. Using position inertia - avoiding small trades when the current position is within 10% of the target - helps reduce unnecessary trading costs. For example, if your target position in crude oil futures is 100 contracts and your current position is 95, you might choose not to trade since the 5-contract difference falls within the 10% threshold. This approach ensures you maintain proper risk exposure while minimizing transaction costs through smart trade execution. Regular rebalancing, typically monthly or quarterly, helps maintain target weights while considering trading costs and market impact.
Trading too frequently can lead to excessive costs that consume profits. Many traders, driven by overconfidence, overtrade and watch their potential profits evaporate in transaction costs. A strategy with high pre-cost performance can become unprofitable if trading costs are too high. Trading costs include execution costs (the difference between mid-price and achieved price), fixed per-trade fees, per-contract fees, and percentage-based fees like UK stamp duty. To meaningfully compare trading costs across instruments, use volatility standardization. The standardized cost measures how much of your annualized Sharpe ratio you'll lose per round trip, calculated as (2 x cost) / (16 x instrument currency volatility). This reveals that lower-volatility instruments have higher effective trading costs, justifying their exclusion from portfolios. Euro Stoxx futures have a standardized cost of 0.002 Sharpe ratio units, making them cheap to trade compared to spread bets on major indices like FTSE 100, which cost around 0.01 SR-about ten times more expensive. Understanding standardized costs is only useful when paired with a standardized measure of trading frequency. Turnover measures the number of round trips (buy and sell of a volatility-standardized position) per year. A turnover of 1 means one buy and sell of an average-sized position annually (12-month holding period), while 52 implies weekly trading. When designing trading systems, you must set appropriate speed limits based on costs. With a recommended cost limit of 0.13 SR annually, you should reject rules with turnovers exceeding: 130 round trips yearly for the cheapest futures (0.001 SR cost per unit turnover), 65 round trips for Euro Stoxx futures (0.002 SR cost), and 13 round trips for spread bets (0.01 SR cost). For semi-automatic traders, average holding period is primarily determined by stop loss settings. Tight stops mean shorter holding periods and higher turnover, restricting you to cheaper instruments due to cost constraints. With spread bets, stops should be set for holding periods of at least six weeks, while the maximum practical holding period is about six months. Capital size also affects trading execution. Large capital traders face challenges when order sizes exceed market depth, potentially "walking the book" and getting progressively worse prices. Small capital traders face position "lumpiness" due to minimum contract sizes. For acceptable risk management, aim for a maximum possible position of at least four instrument blocks.
A good systematic trader embodies several key qualities that extend beyond technical expertise into psychological resilience and disciplined execution. First and foremost is humility - successful traders consistently underestimate their intelligence, skill, and luck. This means preparing extensively for adverse scenarios and avoiding overly complex or clever approaches that often fail in real-world conditions. The most effective trading rules tend to be simple and robust, avoiding over-fitted strategies that work perfectly in backtests but collapse under actual market conditions. Skepticism serves as a crucial defensive trait. Traders must maintain healthy doubt toward brokers promoting expensive services, trainers selling foolproof systems, and even respected authors whose methods may not align with individual circumstances. This skepticism should extend particularly to backtesting results - while historical testing provides valuable insights, markets evolve constantly, and future conditions rarely mirror the past perfectly. Setting realistic expectations is vital: even well-designed, highly diversified systematic trading systems typically achieve Sharpe ratios no higher than 1.0. Semi-automatic traders should expect more modest Sharpe ratios around 0.5, while pure asset allocators might see ratios closer to 0.4. Thoughtful analysis of system performance is essential. Successful traders develop deep understanding of why their strategies make or lose money under different conditions. This includes rigorous cost analysis - knowing exact transaction costs, spreads, and other friction points. A key metric is limiting portfolio turnover to no more than one-third of the expected Sharpe ratio to prevent excessive costs from eroding returns. Maintaining a healthy level of nervousness protects capital. This means trading only with money you can genuinely afford to lose and implementing conservative position sizing through methods like Half-Kelly criterion - setting volatility targets at half the expected Sharpe ratio. Diversification should be maximized across uncorrelated assets while avoiding instruments with insufficient volatility to generate meaningful returns. The paradox of systematic trading lies in being diligent during system development but deliberately hands-off during operation. The urge to tinker with working systems often proves destructive - emotional adjustments typically degrade rather than enhance performance. This requires significant self-discipline and trust in the systematic process. Luck plays an undeniable role in trading outcomes. Even perfect execution of a well-designed system cannot eliminate all risk. Successful traders quantify potential downsides thoroughly and ensure their risk tolerance aligns with possible negative scenarios. As Carver's personal journey illustrates, even extensive financial expertise doesn't immunize traders from emotional decision-making when real money is at stake. The systematic framework's primary value lies not in eliminating risk entirely, but in providing a structured approach to managing it while accounting for human psychological limitations. The path to trading success ultimately involves avoiding common pitfalls rather than discovering perfect strategies. This means maintaining strict risk management, resisting the temptation to override systems, and accepting that consistent modest profits typically outperform aggressive approaches seeking spectacular gains.