Financial metrics and the truth about cash
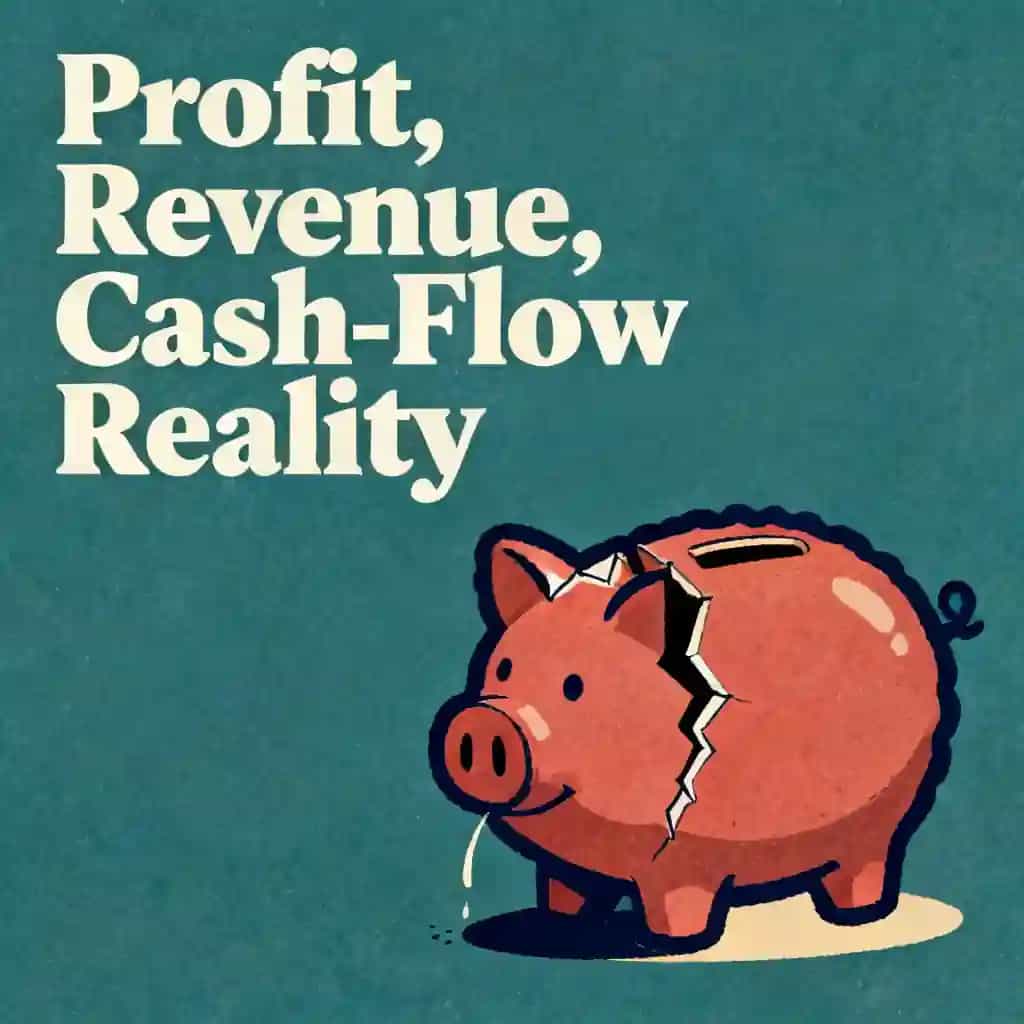
Profit looks good on paper, but cash tells the real story. Learn to read between the lines of financial statements to spot red flags before you invest.
Best quote from Financial metrics and the truth about cash
Profit is an opinion, but cash is a fact. You can argue about how to depreciate a truck, but you can’t argue about whether there’s money in the bank account.
Generated by Alexander
Refresh Financial metrics, language of finance, bigger picture, story that numbers tell, Mastering balance sheets and financial statements, company valuation, investment due diligence with street smartness, things you do not learn in school easy to apply

Frequently Asked Questions
A company can appear profitable on an income statement while "bleeding out" because profit is often based on accounting opinions and non-cash adjustments rather than actual money in the bank. For example, a company might book revenue from sales where the customer hasn't actually paid yet (ballooning accounts receivable) or sell off long-term assets to create a one-time "record profit." If the company cannot collect enough physical cash to pay its immediate bills, it can fail despite what the "Net Income" line says.
Both ratios measure liquidity, but the Quick Ratio—also known as the "acid-test"—is more conservative. The Current Ratio divides all current assets by current liabilities to see if a company can cover its short-term debts. The Quick Ratio takes this a step further by subtracting inventory from those assets before dividing. This asks the brutal question of whether a company can pay its bills without being forced to sell off its stock, which is vital because you cannot pay an electric bill or a creditor with unsold sneakers or car parts.
Free Cash Flow (FCF) is considered the "North Star" for investors because it represents the actual cash a company has left over after paying for its operations and necessary capital expenditures, like new machinery or buildings. Unlike net income, FCF is a "fact" rather than an "opinion." A company with growing FCF has the "staying power" to pay dividends, buy back stock, or reinvest in growth without needing to constantly borrow money from banks.
While a high ROE is generally a sign of a healthy company, it can be artificially inflated through high financial leverage. Since ROE is calculated by dividing Net Income by Shareholders’ Equity, a company can take on massive amounts of debt to buy assets, which keeps the "Equity" portion of the equation very small. This makes even a modest profit look like a huge percentage return. To spot this, investors should compare ROE to Return on Assets (ROA), which measures how hard the company is working its assets regardless of where the money was borrowed.
Key red flags include accounts receivable growing significantly faster than sales, which suggests the company is "stuffing the channel" or that customers aren't paying. Another warning sign is "capitalizing expenses," where a company treats a regular cost (like marketing) as a long-term asset to hide it from the current income statement. Additionally, investors should be wary of sudden changes in accounting methods, complex footnotes that seem designed to confuse, or management selling their own shares while publicly praising the company's performance.
From Columbia University alumni built in San Francisco
"Instead of endless scrolling, I just hit play on BeFreed. It saves me so much time."
"I never knew where to start with nonfiction—BeFreed’s book lists turned into podcasts gave me a clear path."
"Perfect balance between learning and entertainment. Finished ‘Thinking, Fast and Slow’ on my commute this week."
"Crazy how much I learned while walking the dog. BeFreed = small habits → big gains."
"Reading used to feel like a chore. Now it’s just part of my lifestyle."
"Feels effortless compared to reading. I’ve finished 6 books this month already."
"BeFreed turned my guilty doomscrolling into something that feels productive and inspiring."
"BeFreed turned my commute into learning time. 20-min podcasts are perfect for finishing books I never had time for."
"BeFreed replaced my podcast queue. Imagine Spotify for books — that’s it. 🙌"
"It is great for me to learn something from the book without reading it."
"The themed book list podcasts help me connect ideas across authors—like a guided audio journey."
"Makes me feel smarter every time before going to work"