1장
The Financial Crystal Ball: Decoding the Economy's Hidden Signals
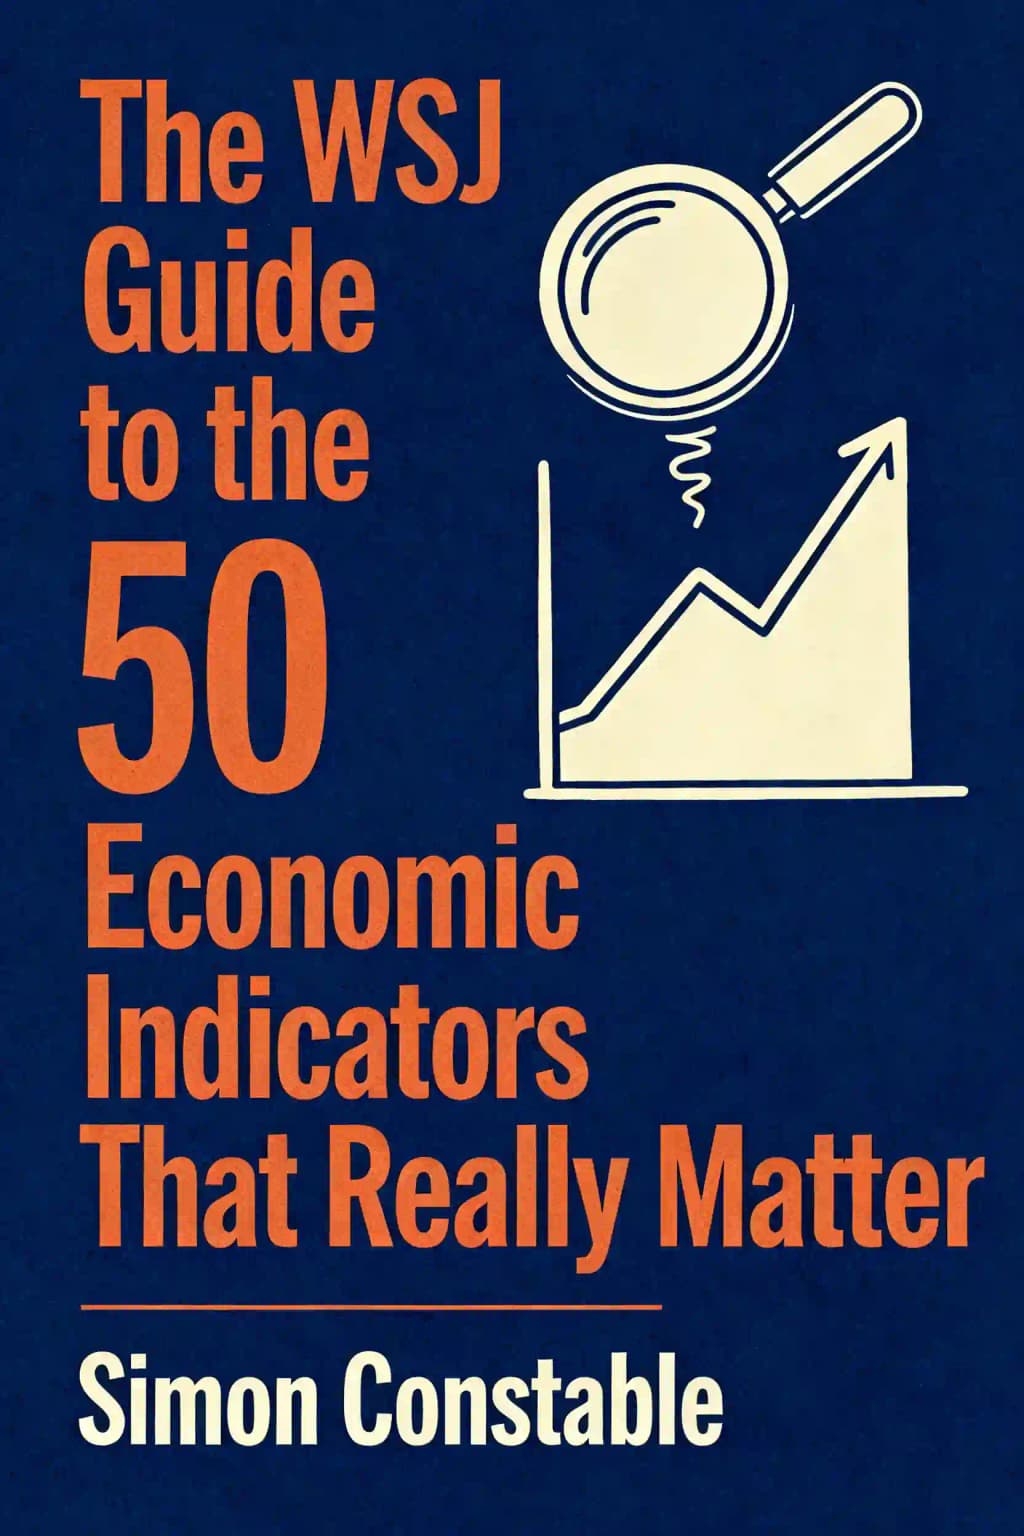
Ever wondered why some investors seem to have a sixth sense for market turns while others get caught in downturns? The secret isn't supernatural ability but rather an understanding of economic indicators that signal changes before they become obvious. While most investors obsessively track well-known metrics like the Consumer Price Index or unemployment rate, true market masters follow a different playbook. They monitor obscure indicators that provide advance warning of economic shifts, allowing them to position their portfolios ahead of the crowd. This approach helped legendary investors like Warren Buffett, who famously studies railroad car loadings and electricity usage patterns to gauge economic health. Even celebrities like Ashton Kutcher, who built a successful venture capital career, attribute their investment success to understanding economic signals beyond headlines. In today's interconnected global economy, these indicators have become more crucial than ever, as market shifts happen faster and with greater magnitude than previous generations experienced.
2장
The Economic Detective's Toolkit
Understanding economic indicators requires thinking like a detective examining clues at a crime scene. These statistical signals fall into three categories: leading indicators that point to future conditions (like building permits and new manufacturing orders), coincident indicators that show current status (such as industrial production and retail sales), and lagging indicators that confirm where we've been (including unemployment rates and consumer price indices). Leading indicators naturally offer the most obvious profit opportunities since they provide advance warning of economic turns, often 3-6 months ahead of major shifts. However, all three types provide valuable insights when properly understood and analyzed in conjunction.
The economy constantly emits signals about its health, but distinguishing meaningful patterns from statistical noise requires following multiple indicators simultaneously. No single metric tells the complete story - even GDP, often considered the holy grail of economic measurement, has significant limitations. Many indicators fluctuate randomly month-to-month, are based on preliminary estimates subject to revision, or require imperfect seasonal adjustments. For example, retail sales data typically sees substantial revisions in subsequent months, and housing starts vary significantly with weather patterns. The key is identifying when several carefully chosen indicators point in the same direction, revealing genuine economic trends rather than statistical anomalies.
Most investors make the classic mistake of focusing on widely-followed indicators that everyone already knows about, such as unemployment rates and consumer confidence indices. This creates a "crowded trade" problem where the information is already priced into markets. The real advantage comes from monitoring lesser-known metrics that provide advance signals about inflation, GDP, and employment before mainstream awareness. These exotic indicators might include cardboard box shipments (indicating future retail activity), semiconductor equipment orders (previewing technology sector health), or Baltic Dry Index (showing global trade momentum). These unconventional metrics give you time to position investments advantageously before the herd catches on.
When analyzing economic data, remember that mathematical models create a false sense of precision. Even official statistics should be viewed as estimates rather than absolute truths, with margins of error often ranging from 2-5%. The Bureau of Labor Statistics regularly revises employment numbers by hundreds of thousands of jobs, and GDP calculations frequently change significantly with each quarterly update. The goal isn't finding exact numbers but understanding basic models of economic causation and recognizing that statistical relationships between variables constantly evolve. Smart investors focus on directional trends and relative changes rather than precise figures, always maintaining healthy skepticism about seemingly definitive economic pronouncements.
3장
Consumer Behavior: The Economy's Driving Force
Consumer spending represents approximately 70% of the U.S. economy, making it the single most important component of economic activity. Several key indicators provide early insights into consumer behavior patterns before they appear in broader economic data.
Automobile sales offer particularly valuable economic signals because the auto industry connects to numerous other sectors through materials like steel, glass, copper, rubber, and plastics. As Campbell Harvey of Duke University notes, "The auto industry is interconnected with so much else." Car purchases represent major financial commitments requiring consumer confidence-people won't buy cars if they fear losing their jobs. When auto sales consistently decrease, economic weakness likely looms ahead; when increasing, improvement may be underway.
Chain store sales provide another window into consumer behavior, available weekly rather than monthly or quarterly like many indicators. Though representing only 10% of retail sales, data from sophisticated national retailers like Saks, The Gap, Costco, and BJ's offers a national perspective on consumption trends. For investors, same-store sales (comparing stores open at least 12 months) prove most valuable, as retail analyst Kristin Bentz explains: "When picking a stock to buy you want sequential and year-over-year same-store-sales growth."
Consumer sentiment directly measures how Americans feel about current and future economic conditions. Two key surveys-The Conference Board's Consumer Confidence Index and the University of Michigan's Consumer Sentiment Index-track this psychological dimension. Both survey households about economic conditions, with higher numbers indicating optimism. Consumer sentiment typically falls dramatically before recessions, though sometimes with multiple false starts before the actual downturn begins. When sentiment genuinely improves, investors should first target consumer staples retailers before moving to discretionary and luxury goods sellers.
Housing market indicators also provide crucial insights through existing home sales data. Home sales impact the economy through both direct spending (furniture, appliances, renovations) and the psychological "wealth effect"-as home prices rise, owners feel wealthier and spend more, even without actual income changes. A key metric is "months of available inventory"-low numbers suggest an improving housing market, while high inventory levels indicate weakness.
4장
Business Investment: The Economy's Amplifier
Business investment constitutes 15-20% of GDP but fluctuates dramatically, making it crucial "at the margin" for economic turns. Unlike consumers who must purchase necessities regardless of economic conditions, businesses can completely halt investment during downturns, making these indicators particularly revealing about economic health.
The semiconductor book-to-bill ratio offers valuable insight by measuring the relationship between chip orders (bookings) and deliveries (billings). With chips powering everything from computers to automobiles, this metric serves as an economic barometer. A ratio above 1.0 indicates order backlogs and economic expansion, while readings below 1.0 suggest excess capacity and weakness. During the Great Recession, the ratio plummeted to 0.47 in January 2009, meaning manufacturers produced twice as many chips as they sold. By July 2009, the ratio exceeded 1.0, signaling recovery ahead of the broader economy.
Copper prices provide another reliable economic signal. Often called "the metal with a PhD in economics," copper serves essential roles in housing, infrastructure, and manufacturing. With relatively stable supply, copper prices directly reflect demand fluctuations in the industrial economy. High prices typically signal economic expansion, while low prices suggest contraction. The relationship between copper prices and economic activity has grown even tighter in the 21st century due to the delicate supply-demand balance.
Industrial production and capacity utilization metrics track manufacturing sector health. Despite concerns about American manufacturing's decline, industrial output remains significant at $1.7 trillion, over one-tenth of GDP. When capacity utilization rates approach upper ranges (near 90%), they often precede cost pressures and price increases as factories reach production limits. This typically benefits capital equipment suppliers as companies must expand through hiring and equipment purchases.
The Institute for Supply Management (ISM) surveys offer crucial insights through the eyes of purchasing managers-the professionals responsible for acquiring raw materials for production. The Purchasing Managers Index (PMI) provides a monthly snapshot where readings above 50 indicate sector expansion, while below 50 signals contraction. Beyond the headline figure, investors should examine subindices, particularly new orders (a leading indicator for future activity) and employment (reflecting manufacturing job health).
5장
Global Interconnections: The World Economy's Pulse
In today's interconnected economy, international indicators provide essential context for understanding domestic conditions. America doesn't exist in isolation-we sell products to foreign countries and buy from them. The difference between exports and imports (net exports) typically reduces U.S. GDP by about 5-10%, but understanding these flows reveals important economic trends.
The Baltic Dry Index (BDI) measures the cost of shipping raw materials like iron ore, coal, and grains across oceans. When global trade increases, particularly for industrial materials, the BDI rises because ship supply is fixed in the short term. China's demand for raw materials heavily influences the index, making it a proxy for Chinese industrial activity. When the BDI rises consistently, it typically signals increasing global industrial production.
America's spending addiction-both consumer and governmental-depends entirely on foreigners' willingness to lend us money. The Treasury International Capital (TIC) data quantifies these capital flows, tracking cross-border purchases and sales of securities plus bank loans and repayments. As Frank Warnock of the University of Virginia explains, the more foreigners want to purchase U.S. securities, the better for Americans, as interest rates are determined by supply and demand for debt securities.
The current account (essentially the trade balance plus net income from interest, dividends, and foreign aid) measures how much more the U.S. buys from other countries than foreigners buy from us. "We pay for those imports by borrowing money or by selling assets to the rest of the world," explains NYU's Paul Wachtel-like selling family silver to put food on the table. A healthy trade deficit should stay under 5% of GDP; when larger, it can signal a looming currency crisis.
Japan's quarterly Tankan Survey provides one of the most comprehensive economic indicators on the planet, polling 9,000 Japanese businesses of all sizes about conditions, expectations, prices, sales, employment, and credit. The main business conditions diffusion index is simple: readings above zero indicate growth, below zero signal recession. Kurt Karl of Swiss Re describes it as "wide and deep" and more reliable than Japan's GDP figures, which undergo wild revisions.
6장
The Money Trail: Financial System Indicators
The financial system serves as the economy's circulatory system, and several indicators reveal its health before problems become obvious in broader economic data.
The Federal Reserve's Fed funds rate functions like a gas pedal and brake for the economy. When the Fed wants to slow economic growth, it raises this overnight bank lending rate; to accelerate growth, it lowers it. Changes ripple immediately through the financial system, affecting mortgage rates, credit card interest, and savings account yields. Even small rate adjustments can dramatically impact debt-burdened households. While difficult to predict, history shows no post-WWII recession has ended without significant Fed funds rate reductions.
Libor (London Inter-bank Offered Rate) measures the trust banks have in each other through the interest rates they charge for short-term, unsecured loans. Rising Libor rates indicate declining fund availability and financial system stress. During normal economic cycles, Libor falls during recessions and rises during booms, but it's particularly revealing during financial crises-as demonstrated in 2008 when it initially dropped as expected but then spiked dramatically during the credit crunch.
Credit spreads-the difference in borrowing costs between high-quality and lower-quality corporate borrowers-provide powerful signals about economic direction. David Ranson of H.C. Wainwright & Co. Economics explains: "Capital being put to work makes the world go round, economically speaking." When spreads widen, investors perceive higher risk, which slows capital flow and chokes economic growth. Conversely, narrowing spreads indicate freer capital flow that fuels growth.
The Ted Spread measures the difference between T-bill yields and Libor, serving as what David Rosenberg calls "the oxygen level in the financial markets." This indicator reveals banks' confidence in lending to each other-a narrow spread indicates confidence, while a widening spread signals caution or panic. Since bank lending directly impacts economic growth, the Ted Spread provides valuable forward guidance about potential credit contractions.
The yield curve-the difference between long-term government securities (ten-year T-notes) and short-term ones (three-month T-bills)-serves as a powerful economic predictor. When this difference turns negative (an "inverted yield curve"), recession probability rises dramatically within four quarters. This indicator's effectiveness stems from the fact that long-term rates represent cumulative bets on future short-term rates. A falling ten-year rate suggests investors anticipate the Federal Reserve will lower short-term rates in response to weakening economic conditions.
7장
Housing Market: The Economy's Foundation
Housing activity provides particularly valuable economic signals because home purchases impact multiple sectors simultaneously. Beyond the direct construction activity, housing drives consumption of durable goods (furniture, appliances, home improvement materials), affects consumer psychology through the wealth effect, and influences financial markets through mortgage activity and securitization. When home values appreciate, homeowners feel wealthier and tend to increase discretionary spending, creating a positive feedback loop in the economy.
Housing permits and starts serve as leading economic indicators because they signal confidence in future conditions. Since houses are major durables expected to last decades, increases in permits and construction starts indicate builders' optimism about sustained consumer employment and income. During recessions, low borrowing costs can trigger the housing cycle as affordable mortgages attract buyers, prompting builders to construct homes and stimulating related industries like lumber, cement, and roofing materials. The ripple effects extend to manufacturers of windows, doors, HVAC systems, and countless other building components, creating jobs across multiple sectors.
New home sales, while typically representing only 15-25% of total home sales, serve as a powerful leading economic indicator because they measure contract signings rather than completed transactions. When thousands of new homes sell, it signals future economic activity as construction begins-workers must be hired and materials manufactured, transported, and installed. The data also reveals buyer confidence, as home purchases require faith in job security and income stability. Each new home construction creates an average of three full-time jobs and generates approximately $90,000 in tax revenue to help fund local communities.
Existing home sales provide complementary information about the broader housing market. The National Association of Realtors' existing home sales report tracks previously occupied homes sold monthly, representing about 85% of housing market activity. It includes crucial inventory levels, median home prices, and days-on-market metrics that indicate market health. Beyond psychological impacts, home purchases directly stimulate the economy through purchases of furniture, housewares and electronics, with the average homebuyer spending roughly $10,000 on related goods and services within the first year. Real estate transactions also generate significant fees for brokers, lenders, insurers, and other service providers. Historically, housing has driven recovery in all ten postwar recessions prior to 2008, typically accounting for 15-18% of GDP when including related goods and services.
The housing market's health also significantly impacts local government revenues through property taxes, transfer fees, and building permits. Additionally, neighborhood stability and property values are closely linked, with well-maintained homes contributing to community development and local business growth. This interconnectedness makes housing market indicators crucial tools for economic forecasting and policy planning.
8장
Fear Gauges: Measuring Market Psychology
Several specialized indicators measure fear and uncertainty in markets, providing early warning of potential problems before they appear in traditional economic data.
The VIX, or CBOE Volatility Index, provides an objective measurement of fear in the markets. It measures the cost investors are willing to pay for protection against stock market declines through S&P 500 options. Higher VIX readings indicate greater investor anxiety. These options function like insurance against market crashes, with prices rising when uncertainty increases. When the VIX spikes over 20% in a day, it often signals excessive fear that creates short-term buying opportunities.
Gold functions as a sensitive barometer for economic, financial, and geopolitical instability. During robust economic periods with sound financial systems and global stability, gold prices typically remain subdued, as witnessed during the 1980s-1990s bear market when prices fell from $850 to $250 per ounce. Conversely, from 2001-2010, gold prices quintupled to over $1,300 amid tech bubbles bursting, real estate speculation, banking system crises, and prolonged wars.
The TIPS spread reveals inflation expectations by comparing yields between standard Treasury bonds and Treasury Inflation Protected Securities. Unlike forecasters' words, this metric shows what sophisticated bond investors actually believe about future inflation by measuring how much they'll pay for inflation protection. Bond expert T.J. Marta notes that 2% seems to be the critical threshold-when the TIPS spread exceeds 2% consistently, the Federal Reserve typically raises interest rates to control inflation.
Retail investment activity serves as a contrarian indicator because individual investors have earned a reputation for making poor timing decisions, typically buying near market highs and selling near lows. By monitoring which fund categories experience the largest inflows or outflows and comparing this with asset performance, investors can identify potential bubbles or unfairly abandoned investments. When retail investors pile into an asset class at historically high levels, it often signals market tops.
9장
Economic Forecasting: Art Meets Science
Economic forecasting requires balancing quantitative analysis with qualitative judgment in an increasingly complex global economy. While data provides essential information, interpretation matters more than the raw numbers themselves. Successful forecasters develop a nuanced understanding of how different indicators interact and what they signal about future economic conditions. Before applying any indicator, it's crucial to distinguish between cyclical changes (normal business cycle fluctuations) and structural changes (fundamental economic transformations like technological disruptions, demographic shifts, or policy regime changes).
The Federal Reserve's Beige Book offers valuable economic insights through anecdotes rather than numbers, serving as a vital qualitative complement to hard data. It compiles detailed reports from business people and economists across twelve Federal Reserve districts, providing granular geographic information that forecasters prize. The reports cover key sectors including manufacturing, real estate, banking, agriculture, and consumer spending. The Beige Book proved prescient before the Great Recession-the November 2006 edition noted "scattered reports of delinquencies on loans to home builders" and "cooling housing markets in several districts," early warning signs of the coming crisis that quantitative indicators hadn't yet captured.
The Philadelphia Federal Reserve produces several valuable indicators, including the Aruoba-Diebold-Scotti Business Conditions Index, which aggregates various economic data into a single, real-time reading on the economy. Updated at least weekly, the ADS combines quarterly output data, unemployment indicators, industrial production, personal income, manufacturing/trade sales, and GDP growth into a smoothed metric where zero represents average conditions. The index is particularly valuable because it captures high-frequency changes in economic conditions and provides a comprehensive view across multiple sectors.
The Economic Cycle Research Institute's Weekly Leading Index (WLI) offers forecasts on economic direction up to eight months ahead. Designed as an improvement over the Conference Board's leading economic indicator, the WLI provides weekly updates with minimal data revisions. ECRI interprets WLI movements using their disciplined "three-P's" approach-changes must be pronounced (significant enough to signal genuine shifts), persistent (lasting several weeks or months), and pervasive (visible across multiple economic inputs). This framework helps distinguish meaningful trends from temporary fluctuations.
The underemployment rate (U-6) offers deeper insight than the headline unemployment figure (U-3) by measuring people working part-time because they can't find full-time work, as well as discouraged workers who've stopped looking for jobs. This forward-looking indicator typically rises before actual layoffs begin, as managers initially reduce hours rather than fire trained workers they've invested in. During recoveries, overtime growth becomes more important to watch, as sustained overtime often precedes new hiring - companies typically increase existing workers' hours before committing to new permanent positions. The spread between U-6 and U-3 rates can signal labor market health, with a widening gap suggesting deteriorating conditions even when headline unemployment remains stable.
10장
Putting It All Together: The Investor's Advantage
The true power of economic indicators emerges when they're analyzed together rather than in isolation. No single indicator provides complete information, but collectively they create a sophisticated portrait of where the economy is heading. By monitoring multiple carefully selected indicators across different sectors - from employment figures and consumer confidence to manufacturing indices and yield curves - investors can identify genuine economic trends before they become obvious to the broader market.
Data immersion across multiple indicators is essential precisely because relationships between metrics change over time. For instance, the traditional relationship between unemployment and inflation (the Phillips Curve) has evolved significantly in recent decades. Following just one or two indicators might cause you to miss structural economic shifts, such as the impact of technological disruption or changing trade patterns. While broad indicators like GDP provide convenience, they sacrifice accuracy by potentially masking underlying sector-specific trends. Conversely, waiting for definitive pronouncements from institutions like the National Bureau of Economic Research, which often come months after economic turning points, means missing critical investment opportunities entirely.
The key is examining diverse indicators across all economic sectors - manufacturing, services, housing, employment, and financial markets - and developing confidence in your judgment despite uncertainty. For example, combining the ISM Manufacturing Index with retail sales data, housing starts, and employment trends can provide early signals of economic direction. This comprehensive approach helps investors avoid the classic mistake of buying high and selling low. Instead of following the crowd into overvalued assets or panic-selling during corrections, you can position your portfolio ahead of economic turns, protecting investments during downturns and maximizing returns during recoveries.
Remember that economic indicators aren't perfect predictors-they're tools that provide probabilistic insights rather than certainties. Leading indicators like building permits or new orders may sometimes give false signals due to temporary disruptions or seasonal factors. The economy's complexity means that even the best indicators occasionally mislead - as demonstrated during the 2008 financial crisis when many traditional relationships broke down. However, by understanding their limitations and using multiple indicators together, while considering their historical reliability and current context, investors can significantly improve their odds of making successful investment decisions.
The greatest advantage comes from developing your own economic intuition through regular monitoring of these indicators. Over time, you'll recognize patterns and relationships that aren't obvious to casual observers - such as how changes in commodity prices might affect consumer spending, or how currency movements influence corporate profits. This experiential knowledge, combined with disciplined analysis of multiple indicators and an understanding of their interrelationships, creates a powerful framework for navigating economic cycles and making profitable investment decisions. Successful investors often maintain their own dashboard of key indicators, regularly updating and refining their analysis based on changing economic conditions and market dynamics.