Capítulo 1
When Markets Defy Logic: A Fractal View of Financial Turbulence
Picture this: The Dow Jones Industrial Average plummets 29.2% in a single day. According to standard financial models, this event should occur once every billion lifetimes of the universe. Yet it happened on October 19, 1987. This wasn't an isolated incident-financial markets routinely experience what conventional theories deem "impossible."
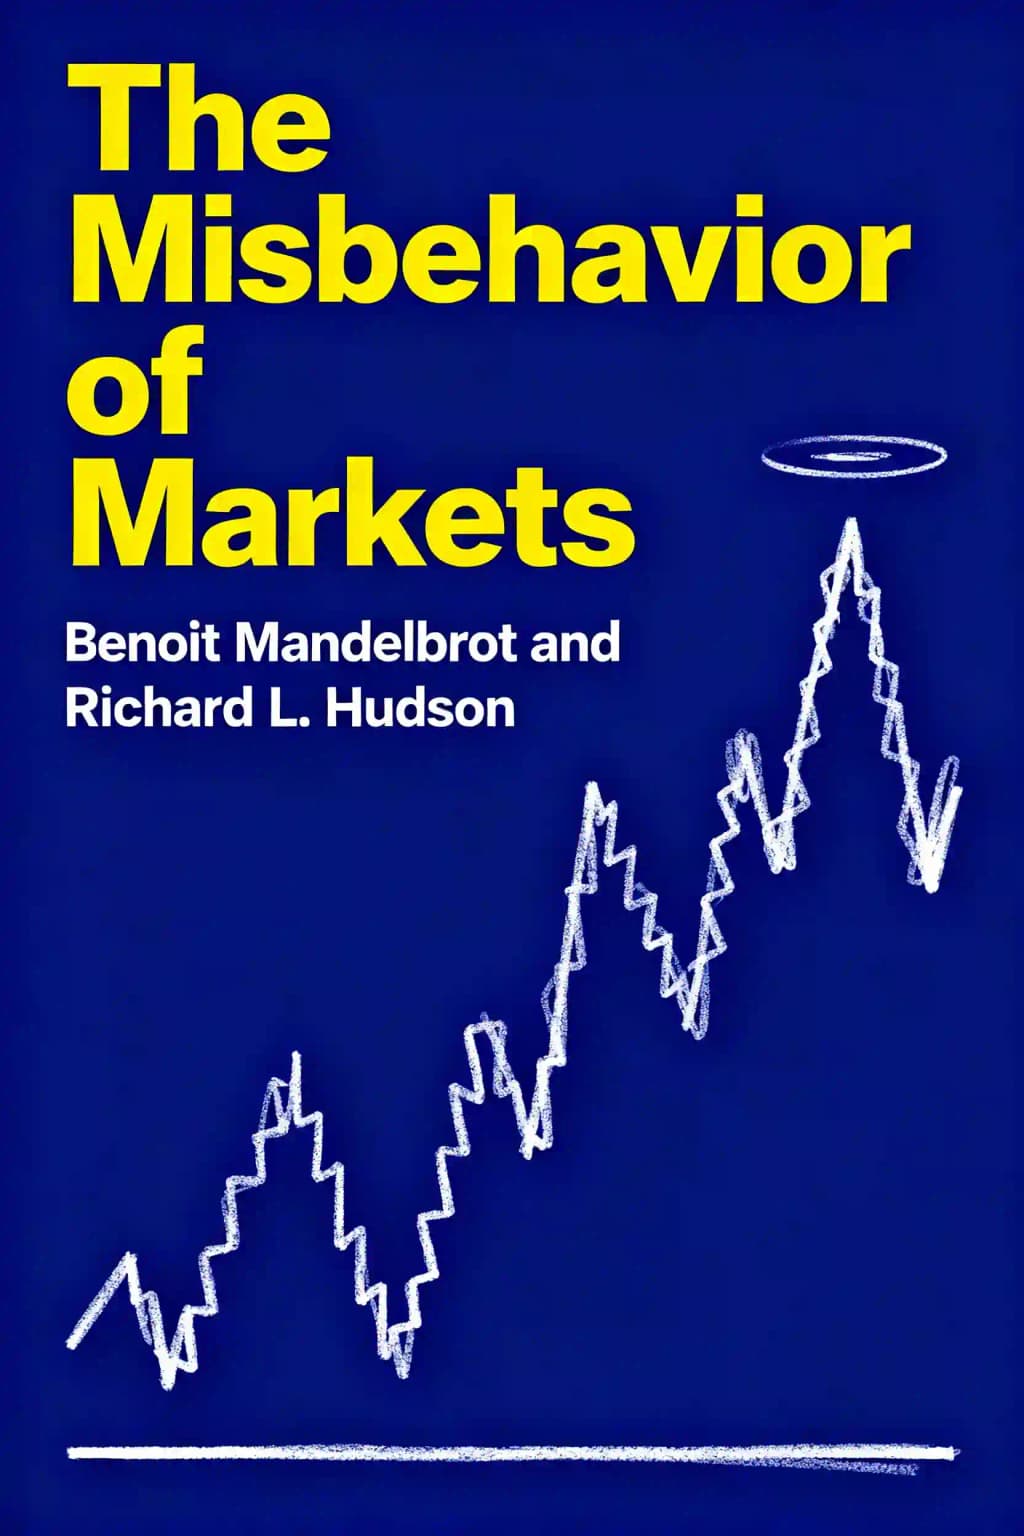
This contradiction sits at the heart of Benoit Mandelbrot's revolutionary work. As the father of fractal geometry, Mandelbrot spent decades challenging orthodox financial theories. His book has become a cult classic among quantitative traders and risk managers, with legendary investor Paul Tudor Jones calling it "a must-read for anyone with a nickel to invest." Even Warren Buffett, who famously quipped he'd fund university chairs in the Efficient Market Hypothesis to train more misguided financiers whose money he could win, acknowledges the flaws in conventional market theories that Mandelbrot exposes. The book's influence extends beyond finance-Nassim Nicholas Taleb built upon Mandelbrot's ideas in his bestselling "Black Swan" theory, fundamentally changing how we think about risk in the modern world.
Capítulo 2
The Fatal Flaws of Modern Finance
The entire edifice of modern financial theory rests on a single, flawed assumption: that price changes follow a bell curve. This elegant mathematical fiction, first applied to finance by Louis Bachelier in 1900, suggests that market movements are like coin tosses-independent, identically distributed events that produce mild, predictable patterns of variation.
This assumption forms the foundation for virtually every financial tool taught in business schools worldwide. Harry Markowitz's Modern Portfolio Theory teaches investors to diversify by combining stocks with different risk profiles. William Sharpe's Capital Asset Pricing Model (CAPM) helps determine the "correct" price for assets based on their risk relative to the market. Fischer Black and Myron Scholes developed a formula for pricing options that revolutionized derivatives trading. All three innovations earned Nobel Prizes, and all three depend critically on the bell curve assumption.
The problem? Real markets don't behave this way.
When Mandelbrot examined a century of cotton prices in the early 1960s, he discovered something shocking: price changes didn't follow a bell curve at all. They exhibited "fat tails"-extreme price movements that occurred far more frequently than theory predicted. In a normal distribution, a five-standard-deviation event (a "five-sigma" move) should happen once every 7,000 years. Yet in financial markets, such moves occur every few years.
The implications are profound. Standard risk measures like beta and standard deviation systematically underestimate true market risk. Portfolio diversification provides less protection than advertised. Option pricing models generate values that traders must constantly adjust through "volatility smiles" and other ad hoc fixes. The entire mathematical foundation of modern finance is built on sand.
Despite overwhelming evidence against the standard model, economists cling to it through what Mandelbrot calls "the persistence of error." They devise increasingly complex patches like GARCH models and Arbitrage Pricing Theory rather than acknowledging the fundamental flaw. This resembles medieval astronomers adding epicycles to preserve the Earth-centered model of the universe rather than accepting Copernicus's heliocentric view.
Capítulo 3
The Fractal Alternative: Markets as Turbulent Systems
If markets don't follow the bell curve, what model better describes them? Mandelbrot proposes a radical alternative: markets behave like turbulent fluids. Just as a river alternates between calm pools and violent rapids, financial markets shift between periods of tranquility and extreme volatility. This analogy extends beyond mere metaphor - the mathematical properties of turbulent flows share remarkable similarities with financial market behavior.
This turbulence exhibits fractal patterns-self-similar structures that repeat at different scales. Zoom in on a small section of a price chart, and it resembles the larger chart, much like how a small piece of coastline mirrors the geometric complexity of the entire shoreline. This property, which Mandelbrot calls "scaling," appears consistently across different markets and time periods. Daily, weekly, and monthly price charts look statistically similar once properly scaled. For instance, the pattern of price movements in cotton futures over a day often mirrors the pattern over a month or even a year.
Mandelbrot identifies two key characteristics of market behavior that conventional theories miss:
1. The Noah Effect (named after the biblical flood): Markets experience discontinuous jumps rather than smooth transitions. Prices don't glide from $10 to $15; they leap, creating gaps that leave traders unable to execute at intermediate prices. The stock market crash of 1987, when the Dow dropped 22% in a single day, exemplifies this effect. Similar jumps occur regularly at smaller scales, such as when earnings announcements or geopolitical events trigger sudden price movements.
2. The Joseph Effect (after the biblical seven years of plenty followed by seven years of famine): Market movements show long-term dependence, where past price changes influence future ones far longer than standard theory allows. This creates apparent trends and cycles that persist before suddenly reversing. The technology boom of the 1990s followed by the 2000 crash, or the housing market's extended rise and subsequent collapse in 2008, demonstrate this pattern of persistent trends followed by dramatic reversals.
These effects combine in a multifractal model that transforms "clock time" into "trading time"-stretching and compressing time to reflect periods of intense activity and relative calm. This matches the real experience of traders, who know that markets sometimes pack a month's worth of action into a single day, while other days pass with barely a price tick. For example, more trading activity might occur in the first hour after a Federal Reserve announcement than in several typical trading days combined.
The fractal model also explains why traditional risk management tools, based on normal distributions, consistently underestimate market risks. By acknowledging the wild, scaling nature of markets, Mandelbrot's approach better captures the true dynamics of financial systems, including the clustering of volatility, the persistence of trends, and the frequent occurrence of extreme events that conventional models consider virtually impossible.
Capítulo 4
Ten Heresies About Financial Markets
Through decades of meticulous observation and mathematical analysis, Mandelbrot distilled ten fundamental truths about markets that radically contradict conventional financial wisdom:
1. Markets are turbulent, behaving like complex fluids rather than mechanical systems. Just as water can flow smoothly or create violent whirlpools, markets shift between periods of calm and chaos. Traditional models that treat markets like predictable machines fail to capture this fundamental turbulence, leading to systematic underestimation of risk.
2. Markets are far riskier than standard theories imagine, explaining why stocks historically outperform bonds by more than theory predicts. Investors demand higher returns because they intuitively understand the true magnitude of market risk, even when formal models don't capture it. The equity premium puzzle - why stocks earn so much more than bonds - becomes less puzzling when true market risk is acknowledged.
3. Market timing matters greatly, with gains and losses concentrating in brief, intense periods. Nearly half the dollar's decline against the yen from 1986 to 2003 occurred on just ten trading days out of 4,695. Similarly, a significant portion of the stock market's total returns over the past century came from just a handful of dramatic trading days. Missing these crucial moments can devastate long-term returns.
4. Prices leap rather than glide, creating discontinuities that invalidate many trading strategies. These jumps occur far more frequently than normal distribution would predict. Stop-loss orders and other risk management techniques based on continuous price movements often fail during these sudden jumps, leading to larger losses than anticipated.
5. In markets, time is flexible - compressing during periods of intense activity and stretching during calm. Trading volume and price volatility cluster together, creating periods where more market activity happens in an hour than in previous weeks. This "trading time" versus "clock time" distinction is crucial for understanding market dynamics.
6. Markets in all places and ages work alike, showing similar fractal patterns across centuries and continents. Whether examining Dutch tulip prices from the 1600s or modern cryptocurrency markets, the same mathematical patterns emerge. This universality suggests fundamental properties of human trading behavior transcend specific assets or eras.
7. Markets are inherently uncertain, and bubbles are inevitable due to the scaling properties of price movements. The same mathematical principles that create small price fluctuations also generate massive market bubbles. These aren't anomalies but natural consequences of market structure.
8. Markets are deceptive, creating illusory patterns that fool our pattern-recognition instincts. Humans excel at finding patterns, even in random data, leading to false confidence in trading strategies. What looks like a clear trend often dissolves into noise upon closer examination.
9. While forecasting specific prices may be perilous, you can estimate the odds of future volatility by recognizing that volatility clusters. Large price movements tend to group together, creating periods of heightened risk. This "volatility clustering" provides a useful tool for risk management, even when price prediction remains impossible.
10. In financial markets, the concept of "intrinsic value" has limited utility, as prices reflect complex interactions rather than rational calculations. Markets are more like ecosystems than adding machines, with prices emerging from the interplay of countless decisions, emotions, and strategies. Fundamental analysis alone cannot capture this complexity.
These heresies challenge the foundations of modern financial theory, suggesting markets are far more complex and dangerous than commonly assumed.
Capítulo 5
The Sierpinski Gasket: A Fractal Primer
To understand how fractals describe markets, consider the Sierpinski gasket-a simple fractal created by repeatedly removing the middle triangle from an equilateral triangle. The resulting pattern shows self-similarity at different scales, with each smaller triangle resembling the whole. After just five iterations, the pattern reveals thousands of identical triangles, each a miniature version of the larger structure. This infinite recursion creates a complex geometric form from simple rules, much like how markets generate complexity from basic trading patterns.
This self-similarity appears throughout nature-in coastlines, clouds, mountain ranges, and tree branches. A cauliflower's florets mirror its overall shape, while fern fronds display identical patterns at every level of magnification. In financial markets, this self-similarity manifests in price charts showing similar patterns whether viewed at daily, weekly, or monthly scales. A market crash viewed on an hourly chart often resembles the pattern of a larger crash viewed over months.
Fractal geometry provides a mathematical framework for measuring this "roughness." While Euclidean geometry assigns whole-number dimensions (lines are one-dimensional, planes are two-dimensional), fractal dimension can be fractional. The British coastline has a fractal dimension of 1.25-more complex than a smooth line (dimension 1) but not filling a plane (dimension 2). Similarly, the Swiss coastline measures 1.15, while Norway's fjord-filled coast reaches 1.52, reflecting its greater complexity.
This dimension provides a yardstick for measuring market wildness. Cotton prices show a fractal dimension indicating stronger variation than wheat prices, reflecting their different market dynamics. For instance, cotton prices might show a fractal dimension of 1.7, suggesting more erratic behavior, while wheat prices hover around 1.4. These measurements help quantify market volatility and risk patterns. Other commodities demonstrate similar fractal characteristics: gold typically shows higher fractal dimensions during crisis periods, while bond markets generally exhibit lower dimensions, indicating more orderly behavior.
The power of fractal analysis lies in its ability to reveal hidden patterns across different time scales. A market's fractal dimension often remains stable even as prices fluctuate wildly, providing a consistent measure of its underlying behavior and helping traders understand its true nature.
Capítulo 6
The Mystery of Cotton: How Mandelbrot Discovered Market Fractals
Mandelbrot's journey into financial fractals began in 1961 when Harvard economist Hendrik Houthakker showed him a diagram of cotton price variations. Surprisingly, the chart resembled Mandelbrot's work on income distribution-both showed a distinctive V-shaped pattern on logarithmic paper.
Intrigued, Mandelbrot analyzed a century of cotton price data and discovered something remarkable: price changes followed a power law distribution rather than a bell curve. Many small price movements coexisted with a few enormous jumps in a consistent mathematical pattern.
Most significantly, this pattern remained stable across different time scales. Daily price variations from 1944-1958, daily variations from 1900-1945, and monthly changes from 1888-1940 all displayed essentially identical patterns. This confirmed what traders had casually observed: price charts look alike regardless of timeframe. Strip away dates and price markers, and you couldn't distinguish daily from monthly charts.
This finding contradicted the standard random walk model, which predicted that price variations should increase with the square root of time. Instead, cotton prices showed the same statistical properties at different scales-the definition of a fractal pattern.
When Mandelbrot published these findings in 1963, they caused an academic uproar. Paul Cootner included Mandelbrot's work in his influential compilation "The Random Character of Stock Market Prices" but added a five-page critique, reluctant to discard "centuries of work" without more convincing proof.
Nevertheless, supporting evidence continued to emerge. Eugene Fama found similar patterns in stock prices, and Richard Roll discovered them in U.S. Treasury bill yields. By 1970, Fama declared there was "conclusive evidence" for Mandelbrot's hypothesis, though orthodox financial theory continued to dominate academic thinking.
Capítulo 7
Abu Nil: Long Memory in Financial Markets
In 1906, British hydrologist H.E. Hurst arrived in Cairo for what became a sixty-two-year study of the Nile River's flooding patterns. Hurst discovered that flood sequences weren't independent random events but showed long-term dependence-wet years tended to follow wet years, dry years followed dry years.
This pattern, which Mandelbrot later called the "Joseph Effect" after the biblical seven years of plenty followed by seven of famine, appears in many natural systems-from tree ring growth to rainfall patterns. In the 1960s, Mandelbrot discovered this same pattern in stock price fluctuations.
While economists typically assume financial prices take random walks with independent steps, Hurst's work suggested something radical: correlations that decrease so slowly they never completely vanish. This "long memory" means past price movements influence future ones far longer than standard theory allows.
Mandelbrot quantifies this tendency with the parameter H (named for Hurst). In standard Brownian motion, H equals 0.5. When H exceeds 0.5, price movements become "persistent" like a stubborn mule, creating long trends in one direction. When H is smaller than 0.5, prices zigzag furiously but within a narrower range.
Research shows different financial assets have different H values. Interest rates show strong dependence (H = 0.7), while wheat prices are more independent (H = 0.5). Volatile tech stocks like Apple (H = 0.75) and IBM (H = 0.72) show stronger persistence than stable utilities (H = 0.54).
These findings challenge modern financial theory's core assumption that price variations are independently and identically distributed. The evidence for long-term dependence increasingly undermines the Efficient Market Hypothesis-which, after all, is merely a hypothesis vulnerable to real data.
Capítulo 8
Multifractal Time: The Unified Theory of Market Behavior
Mandelbrot's most advanced model-the Multifractal Model of Asset Returns-unifies the Noah Effect (wild price jumps) and Joseph Effect (long-term dependence) into a single comprehensive framework. The key insight: financial markets operate in a unique time dimension that expands and contracts based on trading activity, creating a more nuanced understanding of market dynamics than traditional models allow.
This model transforms regular clock time into "trading time" through a sophisticated fractal process. Imagine time as gold ore distributed unevenly across a landscape. Through repeated divisions and redistributions, we create an irregular pattern with peaks of concentration and valleys of scarcity-exactly how trading activity bunches and thins in financial markets. During intense trading periods, time effectively stretches, while it contracts during quieter periods. This mirrors real-world market behavior where a single hour during a market crash might see more significant price movements than an entire week of normal trading.
The model's elegance lies in its ability to naturally produce charts with the hallmark characteristics of real markets: wild fluctuations, fat tails, volatility clustering, and proper scaling relationships. Unlike conventional models that add layers of complexity to patch their flaws, the multifractal approach begins with the unchanging fundamentals of market behavior. For instance, it accurately captures how market volatility tends to cluster - periods of high volatility often follow each other, as do periods of calm, a phenomenon poorly explained by traditional random walk theories.
Testing with dollar-Deutschemark exchange data (over 1.4 million tick-by-tick prices) provided robust confirmation of the model's accuracy. Price changes scaled precisely as predicted, with volatility clustering in a fractal pattern across multiple time frames. The scaling relationship held consistently from two hours to 180 days-an unusually broad range that far exceeds the reliability of conventional models. This consistency across time scales suggests that the same underlying processes drive market behavior whether viewed over hours or months.
The model's versatility allows it to function both forward and backward-generating artificial price charts from fractal seeds and extracting key parameters from raw market data. Using Monte Carlo simulations, researchers can create statistically faithful "forgeries" of real markets to estimate risk, determine optimal portfolio allocations, and calculate proper option values. These simulations prove particularly valuable for stress-testing portfolios and risk management systems, as they capture extreme market events that traditional models often underestimate or ignore entirely.
The practical applications extend beyond theoretical finance. Portfolio managers can use the model to better estimate Value at Risk (VaR), accounting for the higher probability of extreme events. Options traders can more accurately price derivatives by incorporating the model's realistic volatility patterns. Most importantly, the multifractal approach provides a more honest picture of market risk, acknowledging that severe market disruptions occur more frequently than conventional wisdom suggests.
Capítulo 9
Practical Applications: Building a More Resilient Financial System
The fractal view of markets has profound implications for how we manage money and risk. While standard financial theory suggests markets are well-behaved and predictable, the fractal alternative reveals them as dynamic, unpredictable systems requiring robust defenses.
Wall Street's risk management tools, particularly Value at Risk (VAR), rely on flawed Brownian motion assumptions that drastically underestimate potential losses. The real danger isn't just underestimating volatility but missing the catastrophic "overhang"-the actual losses that occur once you enter the unlucky portion of the probability curve. With scaling distributions, this overhang can be devastating.
The 1997-1998 Asian financial crisis demonstrated these risks. Indonesia's quarterly GDP plummeted 18.9 percent, and its currency collapsed by 526 percent. Standard risk models failed to anticipate these extreme outcomes.
Mandelbrot advocates a more pragmatic approach, similar to how the Dutch rebuilt their dikes higher after the devastating 1953 flood that conventional models deemed nearly impossible. We must recognize financial market turbulence and build better safeguards.
This means stress-testing portfolios through Monte Carlo simulations based on more realistic rules of randomness. It means developing new risk measures based on fractal exponents rather than standard deviations. It means acknowledging that markets, like weather, are turbulent systems that require respect and preparation.
The conventional models aren't merely wrong-they're dangerously wrong, like ships built for speed and comfort with little thought to stability in hurricanes. As Myron Scholes acknowledged after his hedge fund Long-Term Capital Management collapsed in 1998, "planning for crises is more important than VAR analysis."
Capítulo 10
The Persistence of Error: Why We Cling to Flawed Models
Despite overwhelming evidence against standard financial theory, it remains the dominant paradigm in business schools and investment firms worldwide. This persistence is particularly striking given the theory's repeated failures to predict or explain major market events, from the 1987 crash to the 2008 financial crisis. Why do economists cling to flawed models with such tenacity?
Unlike astronomers who eagerly revise theories when confronted with contradictory observations, economists keep moving the target. They devise fixes like Arbitrage Pricing Theory and GARCH models to accommodate anomalies rather than questioning fundamental assumptions. When volatility clusters appear that shouldn't exist in efficient markets, they create new mathematical patches instead of reconsidering the underlying framework. This approach resembles adding epicycles to save the geocentric model of the universe rather than accepting heliocentrism.
The old models persist through multiple reinforcing mechanisms. The math is manageable, looks impressive in academic papers, and provides false confidence to practitioners and clients alike. Business schools keep teaching these models because they're established in textbooks, easy to test, and mathematically tractable. This creates a self-perpetuating cycle as thousands of graduates enter the workforce annually, armed with these simplified tools. When reality doesn't match theory, they develop ad hoc adjustments rather than questioning their fundamental training.
Institutional inertia plays a crucial role. Investment firms have built entire risk management systems around standard theories. Changing these would require massive restructuring of technology systems, retraining of personnel, and revision of client communication strategies. The cost and disruption of such changes create powerful incentives to maintain the status quo, even when its flaws are apparent.
Perhaps most importantly, the fractal alternative requires abandoning deeply ingrained beliefs about market behavior. It means accepting that risk is far greater than we've acknowledged, that forecasting is inherently limited, and that catastrophic events are normal features rather than anomalies. This challenges not just technical models but core assumptions about how markets function and how we should approach investment decisions.
As Mandelbrot challenges financial regulators to allocate just a small portion of settlement funds toward fundamental research in market dynamics, his message is clear: we need a new approach that respects the true nature of financial turbulence. He points to successful examples in other fields - if we can map the human genome and predict weather patterns with increasing accuracy, why can't we develop better models for understanding market behavior?
The fractal view offers not just better models but a more honest understanding of market behavior-one that might help prevent the next financial crisis. It suggests building systems robust enough to withstand the storms that inevitably arise in our complex, interconnected economy. This means designing financial institutions and regulations that acknowledge the reality of extreme events rather than treating them as impossible outliers.




![[c637e626-9fda-4ab8-88c1-e3ce6367de3a:c0000] topics in mathematics with applications in finance ocw.pdf p1-1](/_next/image?url=https%3A%2F%2Fd1y2du6z1jfm9e.cloudfront.net%2Fassets%2Fpodcast%2Fpurple.png&w=1024&q=50)
![[c637e626-9fda-4ab8-88c1-e3ce6367de3a:c0001] topics in mathematics with applications in finance ocw.pdf p1-1](/_next/image?url=https%3A%2F%2Fd1y2du6z1jfm9e.cloudfront.net%2Fassets%2Fpodcast%2Fgreen.png&w=1024&q=50)
![[c637e626-9fda-4ab8-88c1-e3ce6367de3a:c0002] topics in mathematics with applications in finance ocw.pdf p1-1](/_next/image?url=https%3A%2F%2Fd1y2du6z1jfm9e.cloudfront.net%2Fassets%2Fpodcast%2Fyellow.png&w=1024&q=50)


