Capítulo 1
Ten Rules That Will Change How You See the World
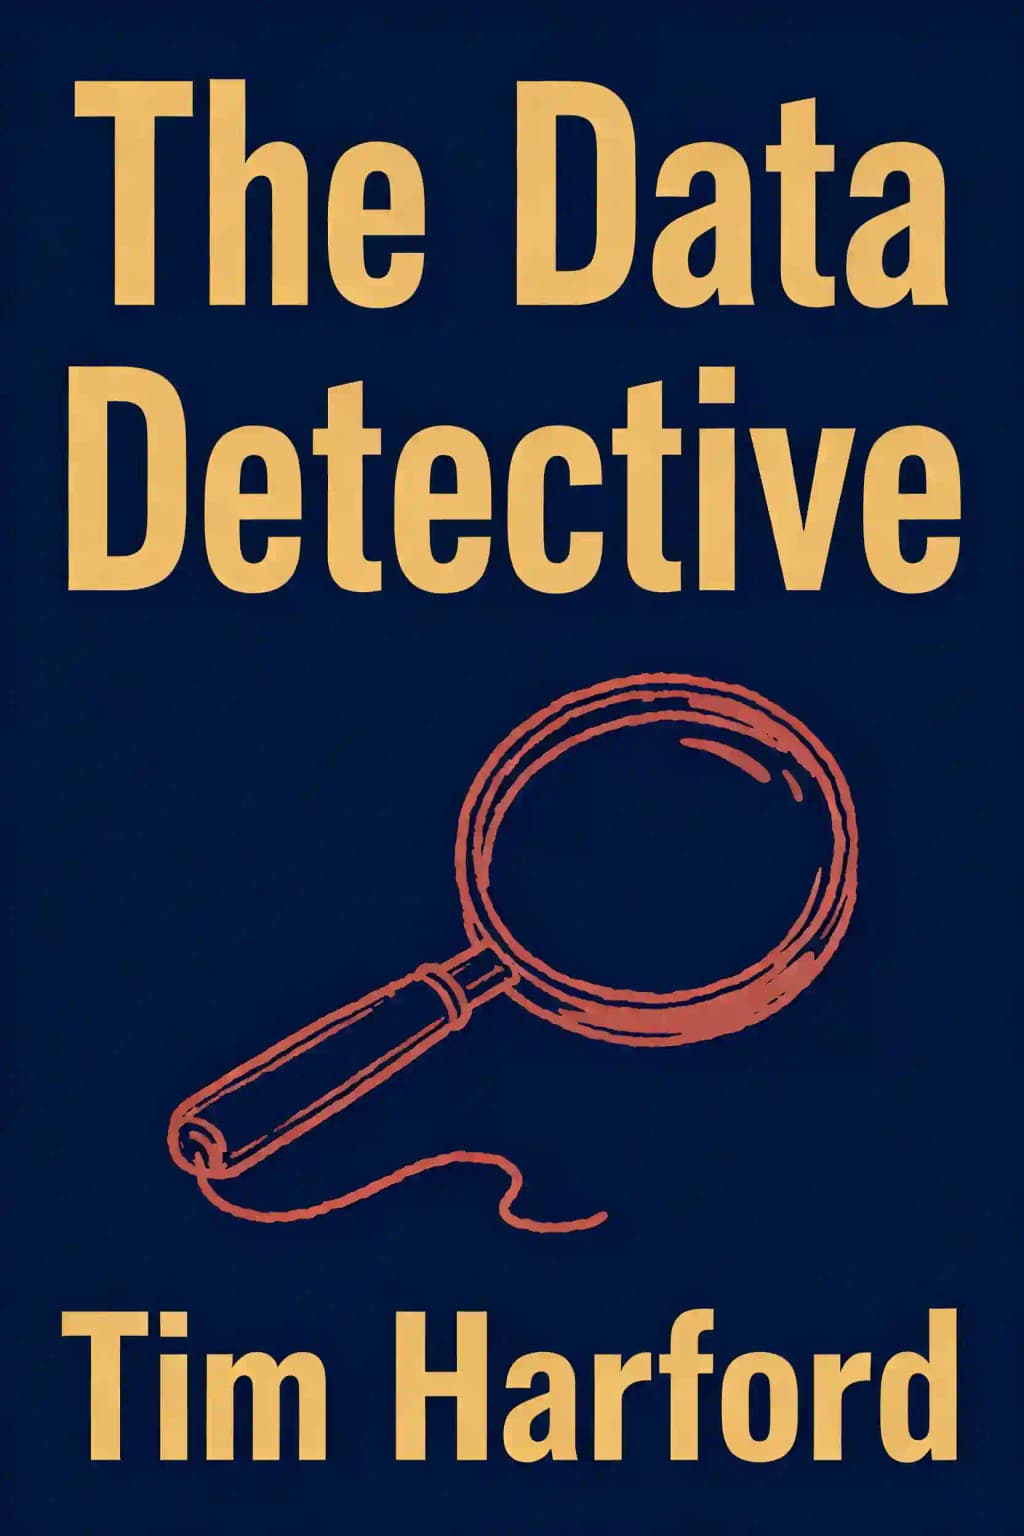
Have you ever heard that statistic about storks delivering babies? There's a remarkably strong correlation between stork populations and birth rates across Europe-strong enough to pass academic publication standards. Of course, this doesn't mean storks actually deliver babies; larger countries simply have more of both storks and people. This statistical sleight of hand exemplifies why Darrell Huff's 1954 book "How to Lie with Statistics" became a million-copy bestseller. Yet the same year Huff published his cynical guide, researchers Richard Doll and Austin Bradford Hill produced groundbreaking statistical evidence that smoking causes lung cancer-work that saved countless lives as doctors became the first social group to quit smoking en masse. Tim Harford's "The Data Detective" has become a modern classic precisely because it bridges these two worlds-teaching us to be skeptical without becoming cynical, and showing how statistics, when used honestly, can literally save lives.
Capítulo 2
When Numbers Trigger Emotions
When confronted with statistical claims, our emotional reactions can severely cloud our judgment and lead to biased interpretations. Psychologist Ziva Kunda demonstrated this phenomenon through several influential studies, most notably when showing subjects evidence that caffeine increased women's risk of breast cysts. While most participants found the evidence convincing, women who were heavy coffee drinkers consistently found ways to discount or reject the findings. This selective skepticism extends beyond health statistics - we see similar patterns in how people process information about climate change, economic data, or political polling.
Stephen Jay Gould's personal story provides a masterclass in overcoming emotional reactions to statistics. Diagnosed with abdominal mesothelioma at age 40, he initially experienced paralyzing anxiety upon reading the eight-month median survival time. However, once he regained his analytical capabilities, he demonstrated how to process statistics more objectively. He realized that median survival meant half of patients lived longer, and identified multiple positive factors in his case: his relative youth, early detection, access to excellent medical care, and his physical fitness. By challenging his initial emotional response with careful analysis, he went on to live another twenty productive years, far outliving the median.
The "ostrich effect" represents another common emotional response to potentially threatening information. Studies show that investors check their portfolios roughly 50% less frequently during market downturns. This avoidance behavior extends to other domains - people postpone medical check-ups when they fear bad news, delay opening bills during financial difficulties, and avoid performance reviews when they suspect criticism. While such avoidance might provide temporary emotional comfort, it often leads to worse outcomes by preventing timely corrective action.
Wishful thinking's influence on statistical reasoning has been demonstrated through multiple experimental frameworks. Guy Mayraz's innovative wheat market experiment revealed how quickly people adopt biased perspectives based on arbitrary role assignments. Participants randomly designated as "farmers" consistently predicted higher wheat prices than those assigned as "bakers," despite analyzing identical market data. This bias persisted even when substantial monetary rewards were offered for accurate predictions.
The case of art historian Abraham Bredius and the Vermeer forgery serves as a cautionary tale about motivated reasoning. Bredius had spent decades developing theories about Vermeer's biblical works and Italian influences - theories that lacked substantial supporting evidence. When Han van Meegeren's forgery "Christ at Emmaus" appeared in 1937, it seemed to validate all of Bredius's hypotheses. Despite numerous technical and stylistic inconsistencies that should have raised red flags - including anachronistic pigments and uncharacteristic brush techniques - Bredius's desperate desire for validation led him to declare the painting "the masterpiece of Johannes Vermeer." This embarrassing episode demonstrates how even world-renowned experts can fall prey to confirmation bias when emotions override analytical thinking.
The key to better statistical reasoning isn't to become emotionless, but rather to develop greater emotional awareness. By consciously asking "How does this information make me feel?" we can identify potential biases in our thinking. Strong emotional reactions - whether vindication, anxiety, anger, or denial - should serve as warning flags prompting us to examine our reasoning more carefully.
Capítulo 3
Personal Experience Versus Statistical Evidence
When statistics contradict personal experiences, we must investigate both perspectives. The author's commute seemed to contradict Transport for London's statistics showing low average occupancy rates. TfL uses contactless payment data and Wi-Fi signals to estimate passenger numbers, making their statistics plausible. The apparent contradiction stems from the difference between average train occupancy and passenger experience-empty trains running counter to commuter flow bring down averages, but most passengers experience crowded conditions. Both perspectives reveal important truths: the passenger experiences overcrowding while TfL correctly reports many underutilized vehicles across their network.
Sometimes statistics should override personal experience, particularly with rare or subtle patterns like smoking's link to lung cancer. Our personal observations-like a chain-smoking grandmother who lived to 90-can mislead us because we don't see enough cases to establish patterns. Medical treatments present similar challenges; when a condition improves after treatment, we can't determine from a single case whether the treatment caused the improvement or if recovery would have happened anyway.
The MMR vaccine-autism connection illustrates how personal experience can mislead. Despite studies of 650,000 children showing no link, many remain convinced based on anecdotes. This happens because autism is typically diagnosed around 15 months or school age-coincidentally when vaccines are administered. These temporal connections create powerful but misleading impressions that statistics can correct.
Our tendency to mistake our perspective for universal truth-"naive realism"-leads to systematic misperceptions. Ipsos Mori found people consistently misjudge social statistics, believing murder rates and terrorism deaths are increasing when they're falling, and vastly overestimating teenage pregnancy rates and Facebook usage. These distortions occur because we form impressions from memorable media stories rather than representative data.
Despite statistics' value, some things can't be learned from spreadsheets alone. Jerry Muller's "The Tyranny of Metrics" critiques management statistics that substitute for relevant experience. When metrics become targets, they create perverse incentives-like cardiac surgeons refusing high-risk patients to maintain success rates or universities seeking applicants to reject to appear more selective. As economists noted, once a measure becomes a target, it ceases to be effective and often corrupts the process it's meant to monitor.
Capítulo 4
Asking the Right Questions Before Analyzing Numbers
When UK hospitals showed varying mortality rates for newborns, clinicians were sent to better-performing hospitals to learn improvements. But Dr. Lucy Smith discovered the difference wasn't in care quality but in classification. Pregnancies ending at 22-23 weeks were recorded as "late miscarriages" in London but as live births followed by death in the Midlands. This recording difference explained the statistical gap. Similar issues affect international comparisons-the US's high infant mortality rate (6.1 versus Finland's 2.3) partly reflects different recording practices. When infant mortality rose in England between 2015-2016, changing recording practices, not declining care quality, explained the increase.
When examining statistical claims, our first question must be: what does the claim actually mean? Seemingly simple acts of counting-whether sheep in a field or deaths from COVID-19-involve complex definitional questions. During the pandemic, reported death figures were dramatically understated because they only counted hospital deaths and were reported with several days' delay. Even basic concepts like "skilled workers" can be misleading: a UK policy paper proposing a freeze on "unskilled immigration" defined "unskilled" as anyone earning under 35,000-a threshold that would exclude most nurses, teachers, and chemists.
Statistics often mislead through context rather than falsehood. The frequently cited 39,773 gun deaths in America (2017) is accurate but commonly misunderstood. Mentioned during coverage of mass shootings, we naturally associate it with homicide, when actually 60% are suicides. This doesn't inherently support either gun control or gun rights positions, but clarity should precede advocacy. Beyond accuracy, premature enumeration represents a failure of empathy-not asking what statistics mean ignores the human stories behind them.
When examining statistics, definitions matter profoundly. The headline about self-harm among teenage girls proves misleading upon inspection-it refers to lifetime occurrence rather than current behavior, and researchers deliberately left "self-harm" undefined, allowing interviewees to interpret it subjectively. This creates an irresponsible conflation between behaviors as disparate as excessive exercise and suicide attempts. While self-harm appears common, actual suicide remains rare (3.5 per 100,000 girls aged 15-19), and boys are twice as likely to die by suicide despite lower self-harm rates.
Capítulo 5
Finding Perspective in a World of Statistical Noise
Headlines like "London's Murder Rate Is Higher Than New York's for the First Time Ever!" may be technically accurate but misleading without context. The truth: London had 184 murders in 1990 compared to New York's 2,262. By 2017, London's murders fell to 130 while New York's dropped dramatically to 292. London remains safer than New York, though both cities are much safer than before. The alarming headline merely captured a statistical blip when London had a bad month (15 murders) while New York had a good one (14 murders). Without proper perspective, such comparisons distort reality rather than illuminate it.
Norwegian social scientists Johan Galtung and Mari Ruge observed that what counts as "news" depends on how frequently we pay attention. Hourly financial updates on Bloomberg differ from weekly analysis in The Economist because the time frame determines what's significant. Imagine a twenty-five-year newspaper-it would highlight long-term trends like falling crime rates rather than monthly fluctuations. A fifty-year newspaper might celebrate avoiding nuclear armageddon or warn about climate change. A hundred-year edition would marvel at child mortality falling eightfold worldwide, while a two-hundred-year paper might headline "Most People Aren't Poor!"-noting that extreme poverty has fallen from affecting 95% of humanity to less than 10% today.
When confronted with statistics like "$25 billion for Trump's border wall," we should ask "Is that a big number?" by making comparisons-that's about two weeks of the US defense budget or $75 per American. Andrew Elliott suggests carrying "landmark numbers" for comparison: the US population (325 million), Earth's circumference (40,000 km), US GDP ($20 trillion), or the height of the Empire State Building (1,454 feet). These reference points help provide crucial context through simple arithmetic, revealing the true scale of statistical claims.
News media rarely provide proper statistical context because they're drawn to the surprising rather than the typical. While humans tend toward optimism in personal matters, media coverage skews negative because shocking events make better headlines than gradual improvements. The frequency mismatch between daily news and slow-moving developments means many significant improvements remain "invisible." This applies to climate change, which gets coverage through protests and summits rather than slow-moving indicators, and financial markets, where Gillian Tett noted how derivatives markets were systematically underreported before the 2007-08 crisis because they didn't match news cycles.
Capítulo 6
When Research Findings Seem Too Good to Be True
A famous psychology study by Iyengar and Lepper found that offering 24 jam varieties attracted more customers but resulted in fewer purchases than offering just 6 varieties. This counterintuitive finding became popular in psychology literature and TED talks. However, when researcher Benjamin Scheibehenne attempted to replicate the study, he couldn't reproduce the results. After compiling published and unpublished studies on choice overload, Scheibehenne found the overall effect was zero-sometimes more choices motivate, sometimes they demotivate. Published papers tended to show stronger effects in either direction, while unpublished ones often showed no effect at all, raising questions about the reliability of even respected academic research.
The internet's famous potato salad Kickstarter that raised over $55,000 gives a misleading impression about crowdfunding success. For every viral campaign like the Pebble smartwatch or the Coolest cooler, countless projects receive zero funding. Silvio Lorusso's website Kickended.com documented these failures, revealing that about 10% of Kickstarter projects receive no funding at all, and fewer than 40% reach their targets. This demonstrates survivorship bias-we hear about successes but rarely about failures, creating systematic distortions in our understanding.
Publication bias is a form of survivorship bias that distorts scientific understanding. Consider Daryl Bem's shocking 2010 paper that appeared to provide statistical evidence that people could see into the future. His experiments, published in a respected journal, showed participants could predict which curtain hid an erotic photograph and that practicing words after a memory test improved recall. While the journal published these extraordinary claims, it refused to publish subsequent studies that failed to replicate these findings, claiming it "did not publish replications." This created a one-sided record where only evidence for precognition was visible.
Brian Nosek, recognizing the flaws in academic psychology's rules after Bem's precognition paper, led a global network of nearly 300 psychologists to systematically rerun 100 studies from prestigious journals. Shockingly, only 39 replicated successfully. This crisis stems partly from publication bias but also from the "publish or perish" incentive system in academia, where researchers' careers depend on publishing quantity rather than quality. This creates perverse incentives to publish surprising but fragile results quickly rather than thoroughly testing them.
Researchers engage in "HARKing" (Hypothesizing After Results Known) when they form hypotheses after seeing data patterns rather than before. While exploring data to find patterns is legitimate science, you must test any resulting hypotheses with new data. Statistician Andrew Gelman calls this problem "the garden of forking paths," where each analytical decision branches like paths in a labyrinth, allowing researchers to reach dramatically different conclusions from the same dataset.
Capítulo 7
The Missing Pieces in Our Statistical Picture
The way we collect data often overlooks crucial perspectives. In Uganda, labor force surveys missed 700,000 workers-mostly women-until questions were redesigned to capture "secondary activities" rather than assuming traditional gender roles. Similarly, measuring household rather than individual income can hide economic inequality within families. When the UK switched child benefits from tax credits (usually paid to fathers) to direct payments to mothers, spending patterns shifted toward women's and children's clothing, revealing that who controls money matters even within households.
Statistical gaps arise from decisions about what to measure. The UN's Sustainable Development Goals are hampered by insufficient data collection on issues like domestic violence. In England, bizarrely, we know more about golfers (from the 200,000-person Active Lives Survey) than about crime victims (from the much smaller 35,000-household Crime Survey).
Size alone doesn't guarantee statistical accuracy. The Literary Digest's infamous 1936 presidential poll gathered 2.4 million responses predicting Landon would defeat Roosevelt by 55% to 41%. The actual result was the opposite: Roosevelt won 61% to 37%. Despite its massive sample, the Digest's methodology was fatally flawed-it surveyed people from telephone directories and car registrations, overrepresenting the wealthy who favored Landon. Meanwhile, George Gallup's much smaller but carefully designed poll correctly predicted Roosevelt's victory.
Modern polling faces growing challenges as response rates decline-from 80% in 1963 British Election Studies to just 55% in 2015. This "dark data" problem contributed to polling errors in both the 2015 UK election and 2016 US election, where Conservative and Trump voters were systematically underrepresented.
Even "found data" from smartphones, online searches, and social media platforms has significant blind spots. Twitter users in the US are disproportionately young, urban, college-educated and black compared to the general population, while gender and racial differences exist across various platforms. During Hurricane Sandy in 2012, researchers tracking social media activity saw Manhattan light up with data while harder-hit areas like Coney Island remained silent-not because they were unaffected, but because power outages prevented residents from posting.
Capítulo 8
When Algorithms Make Life-Changing Decisions
In 2009, Google made headlines with "Google Flu Trends," an algorithm that tracked influenza outbreaks across the US faster than the CDC by analyzing search patterns. Without requiring a single medical checkup, Google's system identified correlations between search terms and flu cases reported by the CDC from 2003-2008, then used current searches to predict outbreaks a week before official reports.
Yet four years later, Google Flu Trends spectacularly failed. During one outbreak, it estimated nearly double the actual cases reported by the CDC, and the project was eventually shut down. What went wrong? Without understanding causation, Google couldn't anticipate when correlations would break down. Their algorithm had inadvertently become part flu detector, part winter detector-correlating flu with seasonal searches like "high school basketball" that also peaked in November.
When algorithms make consequential decisions without transparency, the stakes become much higher. In Washington DC, the IMPACT algorithm fired 206 teachers in 2011 based on student test score improvements, despite serious flaws: small class sizes meant random variation in student performance could dramatically affect ratings, external factors affecting student performance were ignored, and teachers who cheated could game the system at honest colleagues' expense.
Amazon's 2014 attempt to use algorithms for hiring revealed how easily biases are perpetuated. Their system, trained on historical hiring data, learned to penalize resumes containing the word "women's" and downgraded certain all-women's colleges simply because men had historically been preferred. Amazon eventually abandoned the algorithm in 2018 after recognizing this bias.
While algorithms can be flawed, we must compare them to equally fallible humans. During the 2011 London riots, two looters received wildly different sentences for similar crimes-Nicholas Robinson got six months for stealing bottled water, while Richard Johnson received no jail time for premeditated theft of computer games. The disparity likely stemmed from Robinson being sentenced during the height of public anxiety while Johnson was sentenced months later when tensions had eased.
Research by Sendhil Mullainathan analyzing 750,000 bail decisions found that algorithms could have reduced crime-while-on-release by 25% by making better detention decisions, or alternatively could have jailed 40% fewer people without increasing crime. Human judges suffer from "current offense bias," focusing too much on the immediate charge rather than considering a defendant's complete history.
The solution lies in the historical distinction between alchemy and modern science. In the mid-1600s, Blaise Pascal's barometer experiments demonstrated how altitude affects air pressure, leading to rapid scientific advancement. Meanwhile, alchemy-despite using experimental methods and attracting brilliant minds like Newton and Boyle-stagnated. The crucial difference was that alchemy was pursued in secret while science thrived through open debate and transparent methods.
Capítulo 9
The Foundation of a Data-Driven Society
In Puerto Rico, the government's attempt to disband PRIS raised questions about the value of statistical agencies. While claiming budget concerns, the million-dollar cost seems trivial when considering the value statistics provide. Cost-benefit analyses in the UK found census data worth at least 500 million annually-a tenfold return on investment-by enabling better allocation of resources and informing crucial decisions from pension policy to public health.
Government statistics aren't just management tools-they're a public good. Unlike private statistics, government data is typically available to all citizens free of charge, ensuring democratic access. Some data only governments can legally collect, while private providers might charge thousands for access. Even when private firms give away statistics, they're often just "ads in the guise of information."
Public statistics enable citizens to understand social issues, as when W.E.B. Du Bois used census data for his groundbreaking visualizations of African American life in 1900. With reliable statistics, citizens can hold governments accountable while governments make better decisions. When statistics are publicly available, academics and citizens can analyze them, identifying errors that need correction.
When governments treat statistics as political tools rather than public goods, quality suffers. Under Thatcher advisor Sir Derek Rayner's reforms, UK unemployment definitions were changed over thirty times in a decade, usually lowering the headline rate. This destroyed public trust, which took decades to rebuild. The UK's Office for National Statistics is now more trusted than courts, police, and vastly more than politicians or media.
Pre-release access to statistics-giving politicians and officials advance notice-invites corruption. In the UK, where 118 people had early access to unemployment figures, market prices would mysteriously move just before publication, suggesting insider trading. Sweden, which bans pre-release access, shows no such suspicious market movements. Trump's 2018 tweet hinting at good job numbers before their release highlighted this problem. Thankfully, the UK ended pre-release access in 2019, following Sweden's model.
Capítulo 10
Curiosity as the Ultimate Statistical Superpower
Curiosity emerges as the most powerful antidote to statistical manipulation and polarization. While intelligence and education often fail to bridge political divides (with highly educated people sometimes being more polarized on issues like climate change), research by Yale's Dan Kahan discovered that scientific curiosity breaks this pattern.
Kahan's research revealed that scientifically curious people-identified through simple questions like how often they read science books or their preference for science documentaries over sports-behave differently when consuming information. In a fascinating experiment, participants were shown climate change headlines with varying degrees of surprise and skepticism. While most people gravitate toward headlines confirming their existing beliefs, the scientifically curious-regardless of political affiliation-preferred surprising information even when it contradicted their views.
This matters because our brains typically respond to belief-threatening facts with the same anxiety as physical threats. But curious people see surprising claims as engaging puzzles rather than threats. Encouragingly, curiosity exists on a bell curve rather than extremes, suggesting people can be nudged toward greater curiosity.
The "information gap" theory explains that curiosity flourishes in the sweet spot between complete ignorance and complete knowledge. Unfortunately, we often suffer from "the illusion of explanatory depth"-believing we understand everyday objects or policies better than we do. When researchers asked people to explain flush toilets or political policies in detail, their confidence collapsed, and political polarization diminished.
Engaging curiosity requires making information interesting through storytelling, humor, and creative approaches. Stephen Colbert's extended comedy bit exploring campaign finance taught viewers more about Super PACs than newspaper reading or additional years of education. Similarly, NPR's Planet Money illuminated global economics by following the creation of T-shirts from cotton field to retail.
For economists, scientists, and other experts facing public skepticism, the key isn't just clarity and avoiding jargon-it's inspiring wonder and curiosity. Like great science communicators who make us burn with desire to learn more, anyone with complex ideas to convey must first engage people's interest in the fascinating details.
While skepticism has its place-the "where's the trick?" mentality Darrell Huff embodied-it's a depressing place to finish. Curiosity becomes habit-forming once we start peering beneath the surface, recognizing gaps in our knowledge, and treating each question as a path to better questions. To make the world add up, we need open-minded, genuine questions-and once we start asking them, we may find it delightfully difficult to stop.