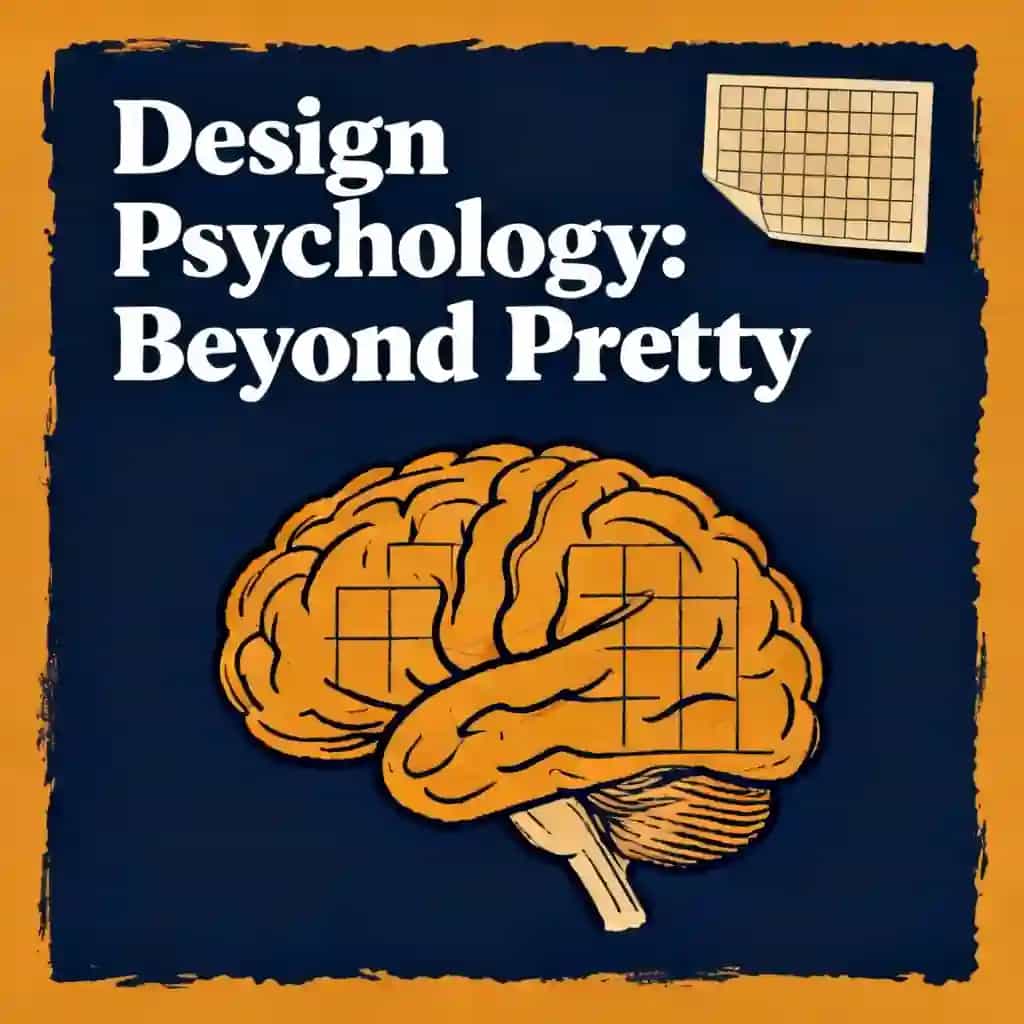
The Psychology of Data Visualization Design
Discover how subtle design choices on data dashboards can trigger panic or clarity. Learn to master visual cues and build high-integrity interfaces that shape user perception.

Mejor cita de The Psychology of Data Visualization Design
There is no 'neutral' way to present a graph; the very act of choosing a scale is an act of interpretation. When a design makes you feel like you are in the middle of a catastrophe, you will look for evidence in the data to support that feeling.
Esta lección de audio fue creada por un miembro de la comunidad BeFreed
https://growth.design/case-studies/coronavirus-dashboard-ux


Preguntas frecuentes
The use of deep red functions as a "psychological megaphone" that triggers an ancient, visceral danger response in the brain. Because red is culturally and biologically associated with stop signs, blood, and emergencies, saturating a map with this color creates an emotional climate of high-alert anxiety. This visual choice often causes the amygdala to process fear before the analytical parts of the brain can interpret the actual statistical data, leading viewers to perceive a catastrophe even if the numbers show nuanced or slowing growth.
A linear scale represents every unit with an equal amount of space, which can make a sudden spike in data look like a terrifying, vertical wall, suggesting an uncontrollable explosion. In contrast, a logarithmic scale focuses on the rate of change rather than absolute numbers, often resulting in a "flatter" curve that helps experts see if growth is accelerating or decelerating. Choosing a linear scale by default often nudges the user toward a more panicked conclusion by emphasizing the sheer magnitude of a crisis rather than the trend of the spread.
The illusion of precision occurs when dashboards display highly granular, real-time numbers—such as "1,245,678 cases"—which creates a false sense of absolute certainty. In reality, data collection during a crisis is often messy due to reporting delays, varying testing capacities, and backlogs. Presenting these numbers with such exactness can lead users to obsess over daily fluctuations or "noise" that may not represent actual trends, rather than using tools like rolling averages to smooth out the data for a more honest representation.
Occlusion happens when data markers, such as circles representing case counts, are so large that they overlap and stack on top of each other. This creates a visual narrative of an "invasion" where a map appears to be physically consumed by a giant red blob, obscuring borders and city names. This design choice visually exaggerates the scale of a problem, making it seem as though an entire region is saturated by a virus even if the actual cases are concentrated in specific, isolated spots.
Designers can prioritize integrity by choosing more neutral color palettes, such as orange or purple, to convey urgency without triggering a fight-or-flight response. They should also provide context by offering toggles between different scales (like linear and logarithmic) and being transparent about data uncertainty through visual cues like soft edges or shaded areas. Finally, balancing the information hierarchy by including "positive" metrics, such as recoveries alongside fatalities, helps ensure the user feels informed and empowered rather than overwhelmed by a narrative of loss.
Descubre más

The Psychology of Daily Choice
This learning plan is essential for anyone feeling overwhelmed by digital distractions and impulsive consumerism. It provides a scientific foundation for professionals and students to reclaim their attention by understanding the neural mechanisms of habit and choice.

Understand & influence human decision-making
In an era of information overload, understanding the hidden mechanics of the mind is a critical competitive advantage. This plan is ideal for leaders, marketers, and designers looking to leverage behavioral science to drive better results and ethical engagement.

Become better at data analytics and UX
In today's digital economy, the most successful products are built at the intersection of objective data and empathetic design. This path is ideal for professionals looking to transition into product roles or designers who want to back their creative intuition with rigorous analytical evidence.

Explore Behavior, Tech & Environment
In an era of digital distraction, understanding the intersection of psychology and design is essential for creating intentional lives and products. This plan is ideal for designers, policymakers, and curious minds looking to reclaim their attention and build environments that support positive behavioral change.
The Science of Better Decisions
In an era of information overload, our natural cognitive defaults often lead to systemic errors in judgment. This plan is essential for professionals and leaders who need to strip away psychological noise and social pressure to make high-stakes decisions with clarity.

Psychology for High-Stakes Meetings
In high-pressure environments, technical expertise is often secondary to social intelligence and emotional control. This plan is designed for leaders and professionals who need to master the psychological undercurrents of the boardroom to influence decisions and manage conflict effectively.

Master Data, AI, Apps & Human Psychology
In an era where technology and human behavior are inextricably linked, understanding the technical stack alone is no longer enough. This curriculum is designed for product leaders and engineers who want to build more impactful, ethical solutions by mastering the intersection of data science, AI architecture, and behavioral psychology.

All options possible
This learning plan is essential for professionals and leaders who need to move beyond intuition to make data-driven, objective decisions. It provides the psychological insights and structural tools necessary to navigate complex business landscapes and overcome the mental hurdles that lead to stagnation.
Creado por exalumnos de la Universidad de Columbia en San Francisco
"Instead of endless scrolling, I just hit play on BeFreed. It saves me so much time."
"I never knew where to start with nonfiction—BeFreed’s book lists turned into podcasts gave me a clear path."
"Perfect balance between learning and entertainment. Finished ‘Thinking, Fast and Slow’ on my commute this week."
"Crazy how much I learned while walking the dog. BeFreed = small habits → big gains."
"Reading used to feel like a chore. Now it’s just part of my lifestyle."
"Feels effortless compared to reading. I’ve finished 6 books this month already."
"BeFreed turned my guilty doomscrolling into something that feels productive and inspiring."
"BeFreed turned my commute into learning time. 20-min podcasts are perfect for finishing books I never had time for."
"BeFreed replaced my podcast queue. Imagine Spotify for books — that’s it. 🙌"
"It is great for me to learn something from the book without reading it."
"The themed book list podcasts help me connect ideas across authors—like a guided audio journey."
"Makes me feel smarter every time before going to work"