Chapter 1
The Inflation Enigma: Understanding Money's Most Misunderstood Force
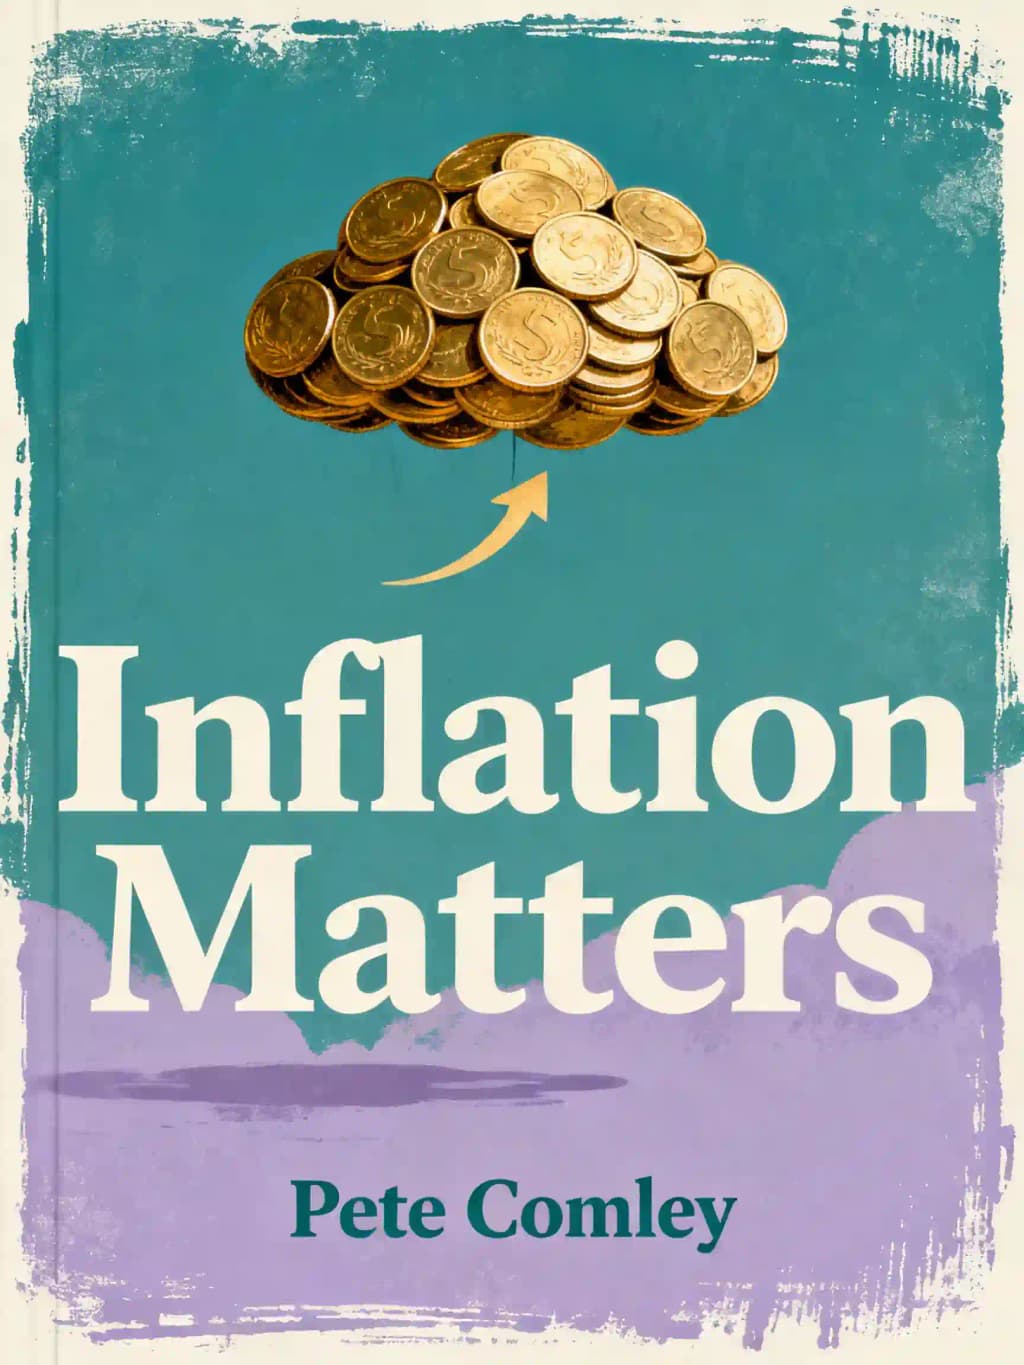
When was the last time you thought deeply about inflation? For most of us, it's that vague economic force making everything more expensive year after year. We accept it as inevitable, like gravity or taxes. But what if everything you thought you knew about inflation was incomplete-or even wrong? Pete Comley's groundbreaking book "Inflation Matters" challenges our fundamental assumptions about this economic phenomenon that silently reshapes our financial lives. This isn't just another dry economic text; it's a revelatory work that Warren Buffett reportedly keeps on his nightstand and has influenced monetary policy discussions at central banks worldwide. By examining inflation through historical, political, and practical lenses, Comley reveals how this misunderstood force creates winners and losers in ways few of us recognize, while offering a provocative thesis: the century-long inflation wave we've all experienced might be coming to an end.
Chapter 2
Unmasking Inflation: More Than Rising Prices
Inflation isn't the simple concept many assume. Modern definitions typically describe it as "a sustained increase in the general price level of goods and services over time," but this barely scratches the surface. The average person equates inflation with rising prices or cost of living increases, while older definitions focused on increases in the money supply beyond what's justified by a country's resources. This distinction is crucial, as it highlights how our understanding of inflation has evolved from a purely monetary phenomenon to a complex economic indicator.
Economists measure several distinct types of inflation, each revealing different aspects of economic health. Goods and services inflation (price inflation) affects daily purchases and living costs. Asset price inflation impacts stocks, bonds, and real estate, often moving independently of consumer prices. Wage inflation reflects labor market pressures and workers' purchasing power. Producer price inflation shows cost pressures at earlier stages of production, often predicting future consumer price changes. Core inflation, excluding volatile elements like food and energy, helps policymakers identify underlying trends. Understanding these variations is essential for grasping inflation's multifaceted nature and its diverse economic impacts.
The monetary theory of inflation, linking price increases to money supply expansion, has strong historical support. The dramatic example of 16th century Europe, when Spanish galleons brought vast quantities of New World gold and silver, causing widespread price increases, demonstrates this relationship. Copernicus first observed this connection in 1517, while John Stewart Mill later formalized it in the quantity theory of money (MV=PQ). This equation shows how money supply (M) and its velocity of circulation (V) relate to price levels (P) and economic output (Q), providing a framework for understanding monetary inflation.
UK economic data over the past century reveals the complex relationship between money supply and inflation. While generally correlative, the connection is complicated by the channeling of new money. Modern financial systems direct much new money into asset markets rather than consumer goods, creating distinct inflation patterns in different sectors. Importantly, the creation of money primarily occurs through commercial bank lending (97% in the UK), rather than government currency printing, challenging common misconceptions about inflation's origins.
Keynesian theory expanded our understanding by identifying demand-pull and cost-push factors. Demand-pull inflation occurs when aggregate demand exceeds supply capacity, while cost-push results from increased production costs, whether from higher taxes, currency devaluation, or rising input prices. Analysis of UK inflation spikes since 1940 supports this dual mechanism, with major episodes triggered by wartime shortages, monetary expansion, sterling devaluation, and oil price shocks. The 1970s stagflation particularly demonstrated how cost-push factors could drive inflation even during economic stagnation.
Malthusian theory provides a long-term perspective on inflation, suggesting that population growth and resource competition drive sustained price increases. This view gains relevance as global demographic shifts affect consumption patterns and resource demand. Modern applications of Malthusian thinking consider technological advancement and resource efficiency alongside population growth. The theory operates alongside other explanations across different timeframes: Malthusian factors for long-term trends, monetary influences for medium-term rates, and Keynesian dynamics for short-term fluctuations, creating a comprehensive framework for understanding inflation's complex nature.
Chapter 3
The Deflation Myth: When Falling Prices Aren't Bad
The negative legacy of 1930s deflation has created a deeply entrenched economic view against falling prices. This perspective, dominant in central banking and academic circles, fails to distinguish between good, bad, and benign deflation, treating all price declines as equally harmful. This oversimplification has led to policies that may actually harm economic growth in certain circumstances.
Bad deflation stems from decreased demand during financial crises when banks restrict credit and money supply contracts. This creates a negative spiral as falling prices increase debt burdens in real terms, potentially leading to defaults and further economic contraction. The Great Depression serves as the classic example, where a 30% price decline combined with widespread bank failures created a devastating economic downturn. However, this represents an extreme case rather than the norm.
Good deflation, by contrast, results from technological improvements, globalization, reduced labor costs, or commodity price drops. When prices fall because things genuinely become cheaper to produce, consumers benefit without economic harm. The Great Deflation of 1870s-1890s provides compelling evidence - despite a 1.7% annual price decline, real wages rose by 3% annually, and GDP growth averaged 4%. This period saw remarkable technological advances including electricity, internal combustion engines, and mass production techniques that dramatically reduced production costs.
Benign deflation can occur from demographic shifts like Japan's aging population, where changing consumption patterns naturally lead to price stability or mild declines without economic damage. Japan's experience since the 1990s demonstrates that moderate deflation (around 1% annually) can coexist with stable employment and continued technological advancement. The country maintained relatively high living standards despite predictions of economic collapse.
Arguments against deflation often confuse symptom with cause. While deflation increases the real cost of servicing debts, evidence from the 1980s-1990s contradicts the theory that this automatically leads to widespread defaults. As inflation rates fell from 20% to near-zero in many developed economies, bankruptcy rates remained stable or even declined in some cases. New Zealand, which experienced significant disinflation in the late 1980s, saw no spike in corporate failures.
Modern corporations heavily reliant on debt financing do suffer during deflation as revenues decline while debt repayments remain fixed. Using Tesco as an example, in 2014 the retailer had market capitalization and debt both around 14bn. A 2% deflation rate would effectively increase their debt burden by 280m annually in real terms. This illustrates how deflation eliminates the "free subsidy" inflation provides to debtors, reducing profits and investment capacity. Similar effects can be seen across the retail sector, particularly in companies with high fixed costs and significant debt loads.
The theory that deflation causes consumers to delay purchases awaiting lower prices contradicts substantial real-world evidence. As an M&G Investments analyst concluded after studying consumer behavior across multiple deflationary periods: "The argument that deflation stops purchases does not hold up in the real world." This theory also conflicts with established economic principles suggesting 10% price drops typically increase unit sales by approximately 10%. Examples include the success of discount retailers like Poundland, which saw consistent growth despite falling prices, and the electronics sector, where unit sales have grown exponentially despite decades of falling prices. The smartphone market particularly demonstrates how consumers eagerly purchase products despite knowing prices will decline.
The winners and losers with deflation are clear: The losers include the most influential groups: companies with high debt loads, banks holding fixed-rate loans, central banks seeking to maintain policy effectiveness, governments managing national debts, mortgage holders, and financial speculators. The primary winner is the general public, particularly during "good deflation" when production costs genuinely decrease. For the average person, especially those on fixed incomes or with savings, deflation can actually increase purchasing power and living standards. This reality suggests that the conventional wisdom about deflation's dangers needs significant revision.
Chapter 4
The Politics of Measurement: How Inflation Statistics Are Manipulated
The UK employs two primary inflation measures with distinct histories and purposes. The Retail Prices Index (RPI) originated during World War I, initially tracking only food prices before expanding to measure working-class cost of living. After major overhauls in 1947 and 1956, it evolved into a comprehensive measure excluding only the highest and lowest earning households.
In contrast, the Consumer Prices Index (CPI), introduced in 1996, was originally called the Harmonised Index of Consumer Prices (HICP) and designed specifically for European comparisons under the Maastricht Treaty. Unlike other European nations that maintain their traditional measures alongside HICP, the UK government has adopted CPI as its preferred inflation measure despite it typically reporting inflation about 1% lower than RPI.
These differences aren't merely technical-they reflect political choices with significant financial implications. CPI excludes crucial housing costs like mortgage interest payments, house prices, and purchase costs that RPI includes. Their calculation methods also diverge, with CPI using geometric means that mathematically produce lower inflation figures than RPI's ratio-based methods.
Creating reliable inflation measures proves challenging as results vary dramatically depending on basket composition, updating rules, weighting methods, and mathematical averaging techniques. Four key issues affect published inflation rates: political influence, item coverage, calculation methodology, and substitution effects.
Inflation indices remain vulnerable to political pressure since they measure government performance. Governments have strong incentives to show low (but not negative) inflation rates, as this also makes economic growth appear stronger. Argentina's official inflation rate is widely believed to be less than half the actual rate, while John Williams' ShadowStats suggests U.S. inflation might be 8% higher than reported if using 1980s calculation methods.
Price indices don't cover everything people spend money on. Most exclude taxation costs and savings/investments, with housing being a major point of difference between UK indices. CPI excludes mortgage payments, house prices, rents, buildings insurance, ground rents and council tax-components that account for over 25% of RPI. This omission significantly impacts reported inflation; in August 2014, excluding housing costs reduced CPI by 0.6% (from 2.1% to 1.5%).
The UK's inflation measures use different calculation methods: RPI pragmatically combines simple averages for items with low price variability and "average of relatives" for more variable items like food and clothing. CPI primarily uses geometric means, which consistently produce lower inflation figures. This switch to geometric means reduced reported inflation by 0.2-0.3% in most countries, but in the UK, the "formula effect" creates a full 1% difference between CPI and RPI.
The cumulative impact is significant-from 2000-2013, RPI showed prices increasing by 50% while CPI showed only 37%, making CPI-indexed incomes 10% worse off than RPI-indexed ones. This matters enormously for pensions, benefits, and wage negotiations.
Chapter 5
Inflation Waves: The Hidden Pattern of Price History
While many contemporary readers assume inflation is an inevitable fact of life, historical examination reveals this isn't true. Throughout history, there have been extended periods-some lasting centuries-of price stability where people lived their entire lives without experiencing inflation. The medieval period from 1200-1500 in England, for instance, saw remarkably stable prices for basic commodities like wheat and wool, with only seasonal fluctuations.
Comley introduces "Inflationary Wave Theory" based on detailed historical analysis showing a marked wave pattern of rising inflation over a century or more, followed by equilibrium periods of stable prices before repeating. Evidence of inflation appears in ancient history, from Babylonian barley prices to Roman denarius debasement, where the silver content dropped from 95% to less than 5% over two centuries. Since medieval times, the UK has experienced distinct inflationary waves followed by consolidation periods, with each wave resulting in exponentially larger price increases than the previous one. The Tudor inflation of 1500-1650 saw prices rise sixfold, while the 20th-century wave produced a hundredfold increase.
These waves typically begin with population growth pressuring resources, not from money supply increases (which follow and amplify the trend). For example, the 16th-century price revolution coincided with European population recovery after the Black Death. Once prices break out of normal fluctuation ranges, an inflationary mindset takes hold-people adopt behaviors reinforcing inflation, from demanding wage increases to borrowing for asset purchases, especially land and housing. This creates a self-reinforcing cycle, as seen in the 1970s wage-price spiral. Governments exploit inflation to erode their debt obligations, as demonstrated by post-WWI Germany and modern quantitative easing programs.
Eventually, inflationary waves crest, historically halted by war or population decline. The 14th-century Black Death ended medieval inflation, while the Napoleonic Wars concluded the 18th-century wave. This leads to a period of relative price stability where prices remain within range, oscillations diminish, asset returns decline, and wage purchasing power rises-often coinciding with cultural renaissances that sow seeds for the next cycle. The Italian Renaissance flourished during such a stable period.
The current inflationary wave began around 1900 (some pinpoint 1896 as the commodity price bottom). Since then, we've experienced over a century of inflation, with UK prices increasing approximately 100-fold. A pound in 1900 would be worth about 120 today. While everyone alive today has only known inflation and assumes it will continue indefinitely, historical patterns suggest this trend will eventually change direction or consolidate.
Previous inflationary waves in the UK lasted between 85-140 years, and we're about 115 years into the current one. The 1500-1650 wave lasted 150 years, while the 1750-1815 episode spanned about 65 years. This suggests a major secular shift may occur within the next 25 years, with some evidence that Japan may already be entering this new phase, having experienced near-zero inflation and interest rates since 1990. The emergence of demographic decline in developed nations and technological deflation could be early indicators of this transition.
Chapter 6
The Great Moderation and Its Aftermath
From the early 1980s, inflation declined worldwide in what became known as the Great Moderation. G7 countries plus China saw average inflation drop from 12% in 1980 to near-zero by 2000, with even hyperinflationary economies like Russia (874% in 1993) and South American nations experiencing dramatic reductions. Brazil, which had suffered 2,947% inflation in 1990, managed to stabilize prices through its Real Plan, while Argentina's convertibility system tamed its chronic inflation problems until 2001.
This moderation period (1985-2007) featured reduced economic volatility and milder business cycles, leading UK Chancellor Gordon Brown to infamously claim the end of "boom and bust." Several factors contributed: technological advances shortened supply chains and improved inventory management through just-in-time systems, cheap Asian labor increased corporate efficiency, and China's 1994 currency devaluation (followed by a dollar peg) flooded Western markets with inexpensive goods. The rise of big-box retailers like Walmart and the emergence of e-commerce further enhanced price competition and transparency.
The 2000s saw inflation return as central banks targeted 2% rates and adopted accommodative monetary policies. After the dot-com crash, Greenspan slashed interest rates from 7% to 1.75%, creating cheap money that exploded debt levels. This credit boom created a global savings glut, with producer nations like China accumulating massive savings and buying US government bonds, keeping interest rates low. By 2007, China held over $1.5 trillion in foreign reserves, while US household debt reached 100% of GDP.
The 2008 financial crisis ended the money supply expansion but not before creating a commodities bubble, with oil reaching $147 per barrel. The Great Recession brought deflationary pressures as demand collapsed, with the US, Japan, China and UK experiencing deflation in 2009. Governments responded with unprecedented measures including Quantitative Easing (with the Fed's balance sheet expanding from $900 billion to $4.5 trillion), near-zero interest rates, and infrastructure projects. Recovery was slow, with most economies taking five years to regain previous GDP levels, while Southern European countries took even longer.
Japan presents a special case study in inflation dynamics, having experienced largely stable prices for two decades while the rest of the world saw significant fluctuations. Contrary to popular belief, Japan hasn't experienced persistent deflation. Prices actually rose 10% in the five years following the bubble burst until 1994, and have remained relatively stable since, with only minor annual declines rarely exceeding 1%. The Bank of Japan's extensive monetary experiments, including negative interest rates and yield curve control, have failed to generate sustained inflation.
The "lost decades" narrative also ignores Japan's demographic reality-its declining workforce and aging population naturally suppress GDP growth. When measured by GDP per worker, Japan actually outperformed most major European economies with 20% growth. Japanese living standards remained high, with unemployment never exceeding 5.5%, universal healthcare coverage, and world-leading life expectancy. This suggests that stable prices, combined with productivity growth, can maintain prosperity even in a demographically challenging environment.
Chapter 7
The Inflation Conveyor Belt: How Wealth Is Secretly Redistributed
Inflation, even at seemingly modest levels of 2-3%, creates a massive wealth transfer mechanism that operates largely unseen by the general public. Historically, inflation's negative effects were partially offset by several factors: interest rates that consistently exceeded inflation rates, regular wage adjustments that matched rising costs, and financial products designed to protect purchasing power. However, this traditional balance was fundamentally disrupted after the 2007/8 financial crisis, ushering in a new economic paradigm.
The current environment of financial repression, characterized by central banks deliberately maintaining interest rates below inflation rates, has created what economists term an "inflation conveyor belt" - a systematic transfer of wealth from savers to debtors. In the UK alone, this transfer amounts to approximately 23 billion pounds annually from savers. The hardest hit are cash holders and those with instant access accounts, typically earning merely 0.4% interest after tax while facing inflation rates of 2.5% or higher. This represents a real terms loss of over 2% annually on savings, a figure that compounds dramatically over time.
Between 2009-2013, UK savers experienced a devastating 13% erosion in their purchasing power, with cumulative losses exceeding 100 billion pounds. This wealth transfer occurred without public outcry, unlike the violent protests in Cyprus when the government attempted a one-time 6.7% levy on savings accounts. The stealth nature of inflation-driven wealth redistribution makes it particularly insidious - most savers remain unaware of the ongoing confiscation of their wealth through monetary devaluation.
Alternative investments have provided little refuge. Stock markets have largely traded sideways since 2000, with dividend income averaging around 3%. However, these modest returns are frequently eroded by multiple factors: investment management charges (typically 1-2%), poor market timing decisions by retail investors, transaction costs, and tax implications. Studies show these factors combined often reduce actual returns by approximately 6%, resulting in negative real returns for many investors. Bond investors face equally challenging conditions, with government bond yields artificially suppressed below inflation rates through quantitative easing programs. This policy ensures guaranteed losses for purchasers of 2-year and 5-year bonds across major economies, with real yields frequently negative after accounting for inflation.
The Great Recession's impact on workers has been particularly severe, as wages have consistently failed to keep pace with inflation across many developed economies. The UK presents a stark example - comparing monthly average weekly wages against RPI (Retail Price Index) from February 2008 to August 2014 reveals wages increased just 5% while RPI rose 22%. This means the average person effectively earns 17% less in real terms, translating to a loss of over 2,500 pounds annually in purchasing power.
In the inflation conveyor belt analogy, individuals and households are almost invariably the ultimate losers through the erosion of their savings, pension wealth, and real wages. The major beneficiaries of this wealth transfer include governments (with 1.4 trillion in debt being devalued), corporations (1.5 trillion), banking institutions (3.4 trillion), and mortgage holders (1.3 trillion). Meanwhile, the losses disproportionately impact pension companies/insurers, individual savers, taxpayers, and personal lenders. This redistribution represents one of the largest ongoing transfers of wealth in modern economic history, occurring largely without public awareness or consent.
Chapter 8
The Future of Inflation: A Return to Price Stability?
The near-term inflation outlook is best described as "lowflation," with numerous deflationary forces suppressing world prices in the aftermath of the financial crisis. Powerful deflationary forces currently at work include the financial crisis overhang and continued bank deleveraging, stagnant economies, high unemployment, competitive currency devaluations, Chinese economic slowdown (reducing global commodity prices), technological advancement (particularly internet-driven disruption), rising government debt levels leading to spending cuts, and aging populations with lower consumption patterns.
Central banks and governments are the primary forces preventing a slide toward near-zero price rises. They've engaged in what appears to be an informal game of "pass-the-parcel," with different countries taking turns staving off deflation through money printing. While these efforts have primarily affected asset prices and compensated for money supply destruction from written-off debts, they've also created latent inflationary pressure in the system.
Ronald Marcks proposed three essential requirements to stop inflation: stable money supply, absence of latent inflation, and restructuring of debt. Without all three conditions met, inflation would likely quickly re-emerge. Analysis of UK data reveals massive latent inflation has built up, requiring either prices to double or money supply to shrink by half to restore equilibrium. World debt has reached unsustainable levels-approximately $223 trillion in 2012 and growing rapidly. Developed countries average debt nearly four times their annual GDP, with some countries like Ireland exceeding ten times GDP.
The transition to price stability will likely involve financial turbulence, with historical precedent suggesting temporary price declines of around 50%. Such disruption would fuel public demand for comprehensive banking and monetary reform. Block chain technology, which underpins digital currencies like Bitcoin, offers a potential solution through its transparent public transaction ledger.
Following the transition phase, the world could enter a period of relatively stable prices extending into the 22nd Century. This stability would incentivize productivity improvements for wage increases, raise real wage values, reduce inequality, and benefit business (though not necessarily finance). The consolidation wave would end the "free lunch" of inflation-driven asset appreciation. Money would return to its original purpose as a method of exchange and store of value, with the ability to create money from nothing largely extinguished.
The consolidation wave would eventually end, likely in the early 22nd century if the approximately 80-year cycle repeats. The trigger would probably be demographic shifts, as the aging baby boomer population passes away and population pyramids become more straight-sided. The growing working population relative to total population would increase government tax revenues and contribute to renewed prosperity, potentially creating another baby boom and forming the basis for the next great inflationary wave.








![[50b2dd0b-2c0c-48b1-a3d3-93e898b68d19:c0000] The New Money Strategy.epub p1-1](/_next/image?url=https%3A%2F%2Fd1y2du6z1jfm9e.cloudfront.net%2Fassets%2Fpodcast%2Fyellow.png&w=1024&q=50)
![[50b2dd0b-2c0c-48b1-a3d3-93e898b68d19:c0001] The New Money Strategy.epub p1-1](/_next/image?url=https%3A%2F%2Fd1y2du6z1jfm9e.cloudfront.net%2Fassets%2Fpodcast%2Fpurple.png&w=1024&q=50)
![[50b2dd0b-2c0c-48b1-a3d3-93e898b68d19:c0002] The New Money Strategy.epub p1-1](/_next/image?url=https%3A%2F%2Fd1y2du6z1jfm9e.cloudfront.net%2Fassets%2Fpodcast%2Fblue.png&w=1024&q=50)